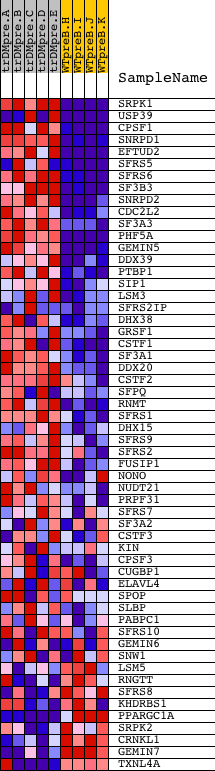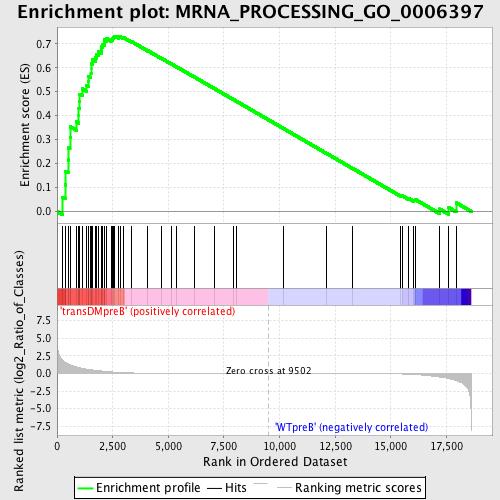
Profile of the Running ES Score & Positions of GeneSet Members on the Rank Ordered List
| Dataset | Set_04_transDMpreB_versus_WTpreB.phenotype_transDMpreB_versus_WTpreB.cls #transDMpreB_versus_WTpreB |
| Phenotype | phenotype_transDMpreB_versus_WTpreB.cls#transDMpreB_versus_WTpreB |
| Upregulated in class | transDMpreB |
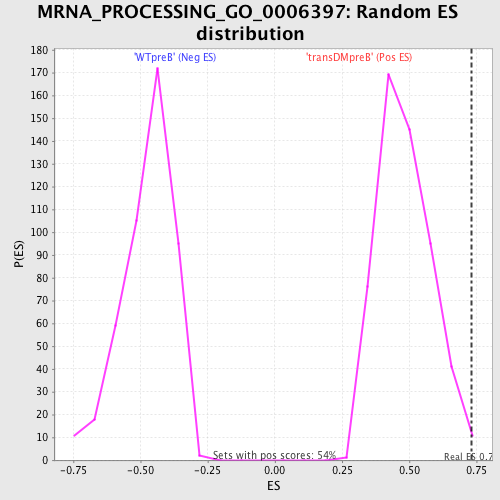
| GeneSet | MRNA_PROCESSING_GO_0006397 |
| Enrichment Score (ES) | 0.73204964 |
| Normalized Enrichment Score (NES) | 1.5139476 |
| Nominal p-value | 0.0055762082 |
| FDR q-value | 0.1732419 |
| FWER p-Value | 0.973 |
| PROBE | DESCRIPTION (from dataset) | GENE SYMBOL | GENE_TITLE | RANK IN GENE LIST | RANK METRIC SCORE | RUNNING ES | CORE ENRICHMENT | |
|---|---|---|---|---|---|---|---|---|
| 1 | SRPK1 | 23049 | 234 | 1.886 | 0.0597 | Yes | ||
| 2 | USP39 | 1116 1083 11373 | 376 | 1.540 | 0.1112 | Yes | ||
| 3 | CPSF1 | 22241 | 394 | 1.518 | 0.1686 | Yes | ||
| 4 | SNRPD1 | 23622 | 497 | 1.354 | 0.2150 | Yes | ||
| 5 | EFTUD2 | 1219 20203 | 512 | 1.329 | 0.2652 | Yes | ||
| 6 | SFRS5 | 9808 2062 | 580 | 1.215 | 0.3082 | Yes | ||
| 7 | SFRS6 | 14751 | 593 | 1.202 | 0.3537 | Yes | ||
| 8 | SF3B3 | 18746 | 870 | 0.918 | 0.3740 | Yes | ||
| 9 | SNRPD2 | 8412 | 976 | 0.825 | 0.4000 | Yes | ||
| 10 | CDC2L2 | 15964 2419 | 979 | 0.822 | 0.4314 | Yes | ||
| 11 | SF3A3 | 16091 | 1007 | 0.801 | 0.4607 | Yes | ||
| 12 | PHF5A | 22194 | 1022 | 0.790 | 0.4903 | Yes | ||
| 13 | GEMIN5 | 20439 | 1134 | 0.713 | 0.5117 | Yes | ||
| 14 | DDX39 | 18551 | 1313 | 0.614 | 0.5256 | Yes | ||
| 15 | PTBP1 | 5303 | 1403 | 0.569 | 0.5426 | Yes | ||
| 16 | SIP1 | 21263 | 1409 | 0.565 | 0.5640 | Yes | ||
| 17 | LSM3 | 12565 | 1522 | 0.522 | 0.5780 | Yes | ||
| 18 | SFRS2IP | 7794 13009 | 1527 | 0.520 | 0.5978 | Yes | ||
| 19 | DHX38 | 48 | 1529 | 0.520 | 0.6177 | Yes | ||
| 20 | GRSF1 | 16487 | 1589 | 0.495 | 0.6335 | Yes | ||
| 21 | CSTF1 | 12515 | 1719 | 0.448 | 0.6437 | Yes | ||
| 22 | SF3A1 | 7450 | 1782 | 0.425 | 0.6567 | Yes | ||
| 23 | DDX20 | 15213 | 1860 | 0.391 | 0.6675 | Yes | ||
| 24 | CSTF2 | 24257 | 1980 | 0.351 | 0.6746 | Yes | ||
| 25 | SFPQ | 12936 | 1999 | 0.345 | 0.6869 | Yes | ||
| 26 | RNMT | 7501 | 2027 | 0.335 | 0.6983 | Yes | ||
| 27 | SFRS1 | 8492 | 2114 | 0.308 | 0.7055 | Yes | ||
| 28 | DHX15 | 8842 | 2129 | 0.304 | 0.7164 | Yes | ||
| 29 | SFRS9 | 16731 | 2228 | 0.274 | 0.7216 | Yes | ||
| 30 | SFRS2 | 9807 20136 | 2432 | 0.218 | 0.7190 | Yes | ||
| 31 | FUSIP1 | 4715 16036 | 2508 | 0.195 | 0.7225 | Yes | ||
| 32 | NONO | 11993 | 2535 | 0.189 | 0.7283 | Yes | ||
| 33 | NUDT21 | 12665 | 2591 | 0.175 | 0.7320 | Yes | ||
| 34 | PRPF31 | 7594 | 2754 | 0.148 | 0.7290 | No | ||
| 35 | SFRS7 | 22889 | 2839 | 0.130 | 0.7295 | No | ||
| 36 | SF3A2 | 19938 | 2978 | 0.109 | 0.7262 | No | ||
| 37 | CSTF3 | 10449 6002 | 3330 | 0.072 | 0.7101 | No | ||
| 38 | KIN | 15120 | 4081 | 0.035 | 0.6710 | No | ||
| 39 | CPSF3 | 7038 | 4677 | 0.023 | 0.6398 | No | ||
| 40 | CUGBP1 | 2805 8819 4576 2924 | 5137 | 0.017 | 0.6158 | No | ||
| 41 | ELAVL4 | 15805 4889 9137 | 5378 | 0.015 | 0.6034 | No | ||
| 42 | SPOP | 5498 | 6186 | 0.010 | 0.5603 | No | ||
| 43 | SLBP | 9822 | 7054 | 0.007 | 0.5139 | No | ||
| 44 | PABPC1 | 5219 9522 9523 23572 | 7922 | 0.004 | 0.4673 | No | ||
| 45 | SFRS10 | 9818 1722 5441 | 8050 | 0.004 | 0.4606 | No | ||
| 46 | GEMIN6 | 12492 7415 | 10191 | -0.002 | 0.3454 | No | ||
| 47 | SNW1 | 7282 | 12116 | -0.007 | 0.2420 | No | ||
| 48 | LSM5 | 7286 | 13254 | -0.014 | 0.1813 | No | ||
| 49 | RNGTT | 10769 2354 6272 | 15433 | -0.072 | 0.0667 | No | ||
| 50 | SFRS8 | 10543 6089 | 15526 | -0.080 | 0.0648 | No | ||
| 51 | KHDRBS1 | 5405 9778 | 15804 | -0.107 | 0.0540 | No | ||
| 52 | PPARGC1A | 16533 | 16024 | -0.143 | 0.0477 | No | ||
| 53 | SRPK2 | 5513 | 16098 | -0.163 | 0.0500 | No | ||
| 54 | CRNKL1 | 14407 | 17192 | -0.504 | 0.0105 | No | ||
| 55 | GEMIN7 | 17944 | 17607 | -0.725 | 0.0160 | No | ||
| 56 | TXNL4A | 6567 11329 | 17933 | -0.999 | 0.0368 | No |