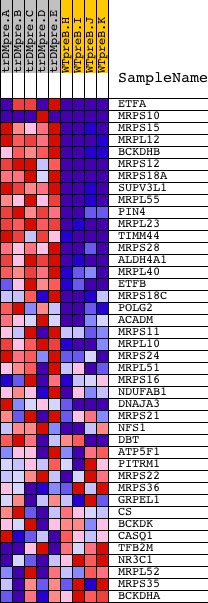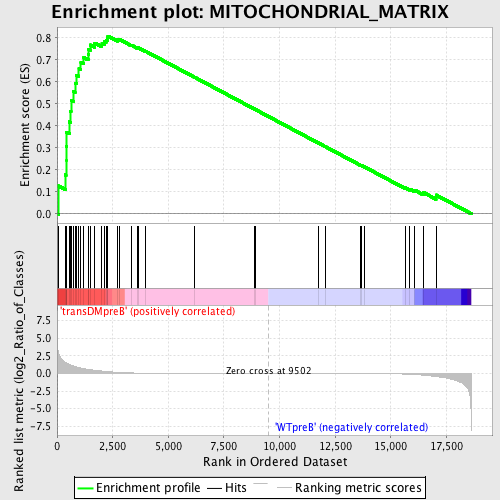
Profile of the Running ES Score & Positions of GeneSet Members on the Rank Ordered List
| Dataset | Set_04_transDMpreB_versus_WTpreB.phenotype_transDMpreB_versus_WTpreB.cls #transDMpreB_versus_WTpreB |
| Phenotype | phenotype_transDMpreB_versus_WTpreB.cls#transDMpreB_versus_WTpreB |
| Upregulated in class | transDMpreB |
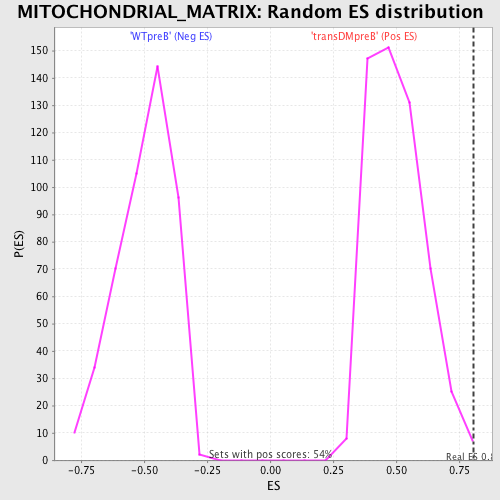
| GeneSet | MITOCHONDRIAL_MATRIX |
| Enrichment Score (ES) | 0.8073701 |
| Normalized Enrichment Score (NES) | 1.6117694 |
| Nominal p-value | 0.0055658626 |
| FDR q-value | 0.045748405 |
| FWER p-Value | 0.303 |
| PROBE | DESCRIPTION (from dataset) | GENE SYMBOL | GENE_TITLE | RANK IN GENE LIST | RANK METRIC SCORE | RUNNING ES | CORE ENRICHMENT | |
|---|---|---|---|---|---|---|---|---|
| 1 | ETFA | 4292 8495 3155 | 63 | 2.983 | 0.1264 | Yes | ||
| 2 | MRPS10 | 7229 12261 23212 | 371 | 1.545 | 0.1771 | Yes | ||
| 3 | MRPS15 | 2442 12345 | 402 | 1.507 | 0.2410 | Yes | ||
| 4 | MRPL12 | 12090 | 407 | 1.502 | 0.3061 | Yes | ||
| 5 | BCKDHB | 19365 | 424 | 1.483 | 0.3697 | Yes | ||
| 6 | MRPS12 | 17907 6273 | 553 | 1.262 | 0.4177 | Yes | ||
| 7 | MRPS18A | 23222 | 609 | 1.182 | 0.4662 | Yes | ||
| 8 | SUPV3L1 | 11677 | 627 | 1.165 | 0.5160 | Yes | ||
| 9 | MRPL55 | 20864 | 746 | 1.034 | 0.5546 | Yes | ||
| 10 | PIN4 | 12817 | 809 | 0.970 | 0.5934 | Yes | ||
| 11 | MRPL23 | 9738 | 877 | 0.912 | 0.6295 | Yes | ||
| 12 | TIMM44 | 3858 18941 | 982 | 0.817 | 0.6595 | Yes | ||
| 13 | MRPS28 | 15377 | 1070 | 0.755 | 0.6876 | Yes | ||
| 14 | ALDH4A1 | 16011 | 1199 | 0.675 | 0.7101 | Yes | ||
| 15 | MRPL40 | 22641 | 1397 | 0.571 | 0.7243 | Yes | ||
| 16 | ETFB | 18279 | 1423 | 0.559 | 0.7473 | Yes | ||
| 17 | MRPS18C | 12728 | 1487 | 0.535 | 0.7672 | Yes | ||
| 18 | POLG2 | 20180 | 1694 | 0.455 | 0.7759 | Yes | ||
| 19 | ACADM | 15133 1800 | 2016 | 0.337 | 0.7733 | Yes | ||
| 20 | MRPS11 | 12621 3150 | 2117 | 0.307 | 0.7812 | Yes | ||
| 21 | MRPL10 | 20681 | 2200 | 0.280 | 0.7890 | Yes | ||
| 22 | MRPS24 | 12262 | 2255 | 0.265 | 0.7976 | Yes | ||
| 23 | MRPL51 | 12361 7301 | 2282 | 0.257 | 0.8074 | Yes | ||
| 24 | MRPS16 | 12311 | 2705 | 0.156 | 0.7914 | No | ||
| 25 | NDUFAB1 | 7667 | 2801 | 0.139 | 0.7924 | No | ||
| 26 | DNAJA3 | 1732 13518 | 3357 | 0.070 | 0.7655 | No | ||
| 27 | MRPS21 | 12323 | 3601 | 0.054 | 0.7548 | No | ||
| 28 | NFS1 | 2903 14377 | 3640 | 0.052 | 0.7550 | No | ||
| 29 | DBT | 1770 4599 | 3991 | 0.038 | 0.7378 | No | ||
| 30 | ATP5F1 | 15212 | 6185 | 0.010 | 0.6202 | No | ||
| 31 | PITRM1 | 21710 | 8876 | 0.002 | 0.4754 | No | ||
| 32 | MRPS22 | 19031 | 8918 | 0.001 | 0.4733 | No | ||
| 33 | MRPS36 | 7257 | 11759 | -0.006 | 0.3207 | No | ||
| 34 | GRPEL1 | 16863 | 12071 | -0.007 | 0.3042 | No | ||
| 35 | CS | 19839 | 13645 | -0.017 | 0.2203 | No | ||
| 36 | BCKDK | 18061 1391 | 13699 | -0.018 | 0.2182 | No | ||
| 37 | CASQ1 | 13752 8695 | 13801 | -0.019 | 0.2136 | No | ||
| 38 | TFB2M | 4024 9092 4083 | 15652 | -0.090 | 0.1179 | No | ||
| 39 | NR3C1 | 9043 | 15860 | -0.114 | 0.1118 | No | ||
| 40 | MRPL52 | 22019 | 16065 | -0.152 | 0.1074 | No | ||
| 41 | MRPS35 | 17237 1068 | 16462 | -0.244 | 0.0967 | No | ||
| 42 | BCKDHA | 17925 | 17032 | -0.442 | 0.0853 | No |