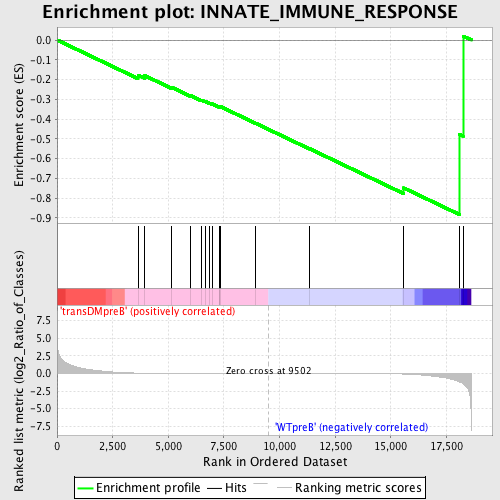
Profile of the Running ES Score & Positions of GeneSet Members on the Rank Ordered List
| Dataset | Set_04_transDMpreB_versus_WTpreB.phenotype_transDMpreB_versus_WTpreB.cls #transDMpreB_versus_WTpreB |
| Phenotype | phenotype_transDMpreB_versus_WTpreB.cls#transDMpreB_versus_WTpreB |
| Upregulated in class | WTpreB |
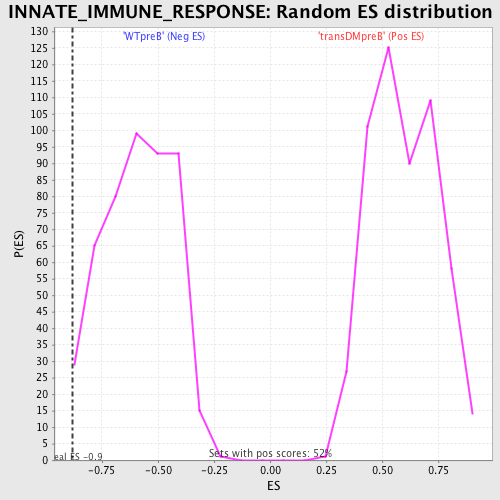
| GeneSet | INNATE_IMMUNE_RESPONSE |
| Enrichment Score (ES) | -0.88291913 |
| Normalized Enrichment Score (NES) | -1.4992214 |
| Nominal p-value | 0.016842104 |
| FDR q-value | 0.38937998 |
| FWER p-Value | 0.994 |
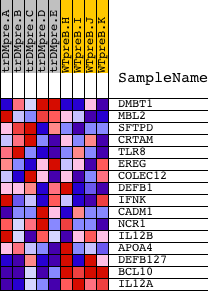
| PROBE | DESCRIPTION (from dataset) | GENE SYMBOL | GENE_TITLE | RANK IN GENE LIST | RANK METRIC SCORE | RUNNING ES | CORE ENRICHMENT | |
|---|---|---|---|---|---|---|---|---|
| 1 | DMBT1 | 18050 | 3636 | 0.052 | -0.1776 | No | ||
| 2 | MBL2 | 23886 | 3940 | 0.040 | -0.1803 | No | ||
| 3 | SFTPD | 21867 | 5155 | 0.017 | -0.2397 | No | ||
| 4 | CRTAM | 19160 | 6005 | 0.011 | -0.2817 | No | ||
| 5 | TLR8 | 9308 | 6502 | 0.009 | -0.3054 | No | ||
| 6 | EREG | 4679 16797 | 6651 | 0.008 | -0.3106 | No | ||
| 7 | COLEC12 | 23624 8946 | 6861 | 0.007 | -0.3194 | No | ||
| 8 | DEFB1 | 18663 | 6982 | 0.007 | -0.3235 | No | ||
| 9 | IFNK | 11837 | 7304 | 0.006 | -0.3388 | No | ||
| 10 | CADM1 | 7057 | 7306 | 0.006 | -0.3369 | No | ||
| 11 | NCR1 | 18409 | 7363 | 0.005 | -0.3381 | No | ||
| 12 | IL12B | 20918 | 8911 | 0.001 | -0.4207 | No | ||
| 13 | APOA4 | 4401 | 11349 | -0.005 | -0.5501 | No | ||
| 14 | DEFB127 | 622 | 15581 | -0.085 | -0.7487 | Yes | ||
| 15 | BCL10 | 15397 | 18079 | -1.187 | -0.4770 | Yes | ||
| 16 | IL12A | 4913 | 18250 | -1.479 | 0.0197 | Yes |