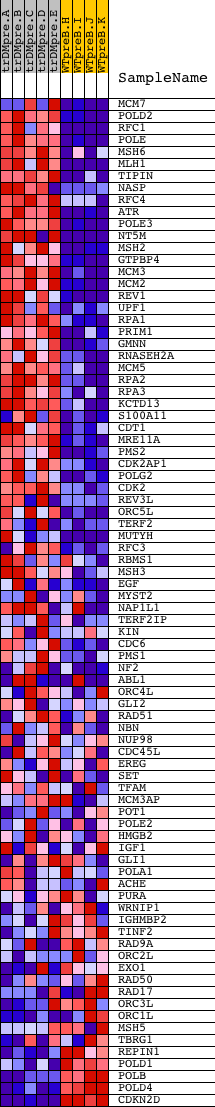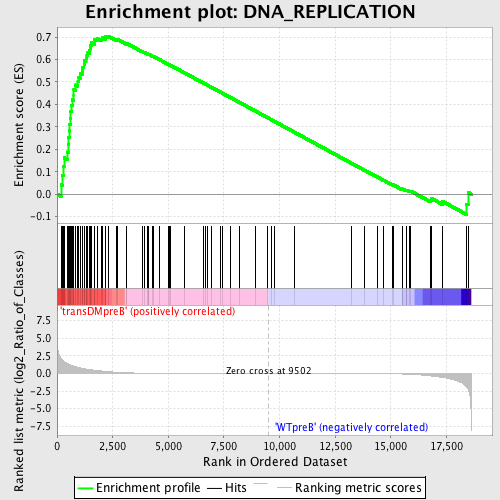
Profile of the Running ES Score & Positions of GeneSet Members on the Rank Ordered List
| Dataset | Set_04_transDMpreB_versus_WTpreB.phenotype_transDMpreB_versus_WTpreB.cls #transDMpreB_versus_WTpreB |
| Phenotype | phenotype_transDMpreB_versus_WTpreB.cls#transDMpreB_versus_WTpreB |
| Upregulated in class | transDMpreB |
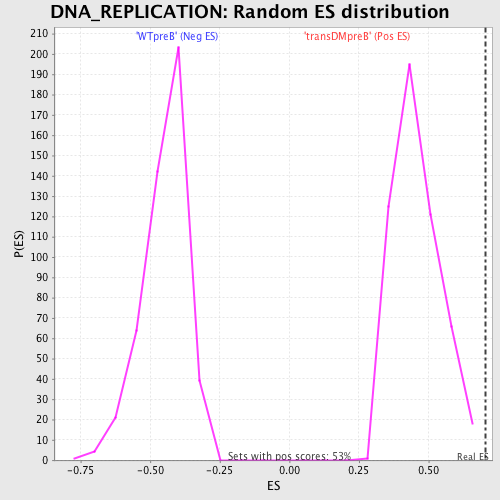
| GeneSet | DNA_REPLICATION |
| Enrichment Score (ES) | 0.703971 |
| Normalized Enrichment Score (NES) | 1.5391535 |
| Nominal p-value | 0.0 |
| FDR q-value | 0.13003951 |
| FWER p-Value | 0.874 |
| PROBE | DESCRIPTION (from dataset) | GENE SYMBOL | GENE_TITLE | RANK IN GENE LIST | RANK METRIC SCORE | RUNNING ES | CORE ENRICHMENT | |
|---|---|---|---|---|---|---|---|---|
| 1 | MCM7 | 9372 3568 | 178 | 2.099 | 0.0422 | Yes | ||
| 2 | POLD2 | 20537 | 245 | 1.841 | 0.0840 | Yes | ||
| 3 | RFC1 | 16527 | 282 | 1.712 | 0.1243 | Yes | ||
| 4 | POLE | 16755 | 314 | 1.622 | 0.1627 | Yes | ||
| 5 | MSH6 | 23137 5120 | 480 | 1.386 | 0.1880 | Yes | ||
| 6 | MLH1 | 18982 | 502 | 1.345 | 0.2200 | Yes | ||
| 7 | TIPIN | 3013 7258 | 520 | 1.320 | 0.2517 | Yes | ||
| 8 | NASP | 2383 2387 6955 | 545 | 1.283 | 0.2820 | Yes | ||
| 9 | RFC4 | 1735 22627 | 560 | 1.250 | 0.3121 | Yes | ||
| 10 | ATR | 19349 | 606 | 1.184 | 0.3389 | Yes | ||
| 11 | POLE3 | 7200 | 616 | 1.176 | 0.3675 | Yes | ||
| 12 | NT5M | 8345 4175 | 637 | 1.153 | 0.3948 | Yes | ||
| 13 | MSH2 | 23138 | 676 | 1.101 | 0.4199 | Yes | ||
| 14 | GTPBP4 | 21548 | 753 | 1.028 | 0.4412 | Yes | ||
| 15 | MCM3 | 13991 | 755 | 1.026 | 0.4664 | Yes | ||
| 16 | MCM2 | 17074 | 826 | 0.958 | 0.4863 | Yes | ||
| 17 | REV1 | 13971 | 937 | 0.862 | 0.5016 | Yes | ||
| 18 | UPF1 | 9718 18855 | 968 | 0.836 | 0.5206 | Yes | ||
| 19 | RPA1 | 20349 | 1036 | 0.778 | 0.5362 | Yes | ||
| 20 | PRIM1 | 19847 | 1125 | 0.723 | 0.5493 | Yes | ||
| 21 | GMNN | 21513 | 1145 | 0.706 | 0.5657 | Yes | ||
| 22 | RNASEH2A | 12819 | 1208 | 0.670 | 0.5789 | Yes | ||
| 23 | MCM5 | 18564 | 1236 | 0.655 | 0.5936 | Yes | ||
| 24 | RPA2 | 2330 16057 | 1299 | 0.622 | 0.6056 | Yes | ||
| 25 | RPA3 | 12667 | 1341 | 0.601 | 0.6182 | Yes | ||
| 26 | KCTD13 | 10609 | 1384 | 0.578 | 0.6302 | Yes | ||
| 27 | S100A11 | 9771 | 1465 | 0.542 | 0.6392 | Yes | ||
| 28 | CDT1 | 18437 | 1479 | 0.538 | 0.6518 | Yes | ||
| 29 | MRE11A | 3014 19560 | 1498 | 0.532 | 0.6639 | Yes | ||
| 30 | PMS2 | 16632 | 1547 | 0.515 | 0.6740 | Yes | ||
| 31 | CDK2AP1 | 8858 | 1691 | 0.455 | 0.6776 | Yes | ||
| 32 | POLG2 | 20180 | 1694 | 0.455 | 0.6887 | Yes | ||
| 33 | CDK2 | 3438 3373 19592 3322 | 1795 | 0.415 | 0.6935 | Yes | ||
| 34 | REV3L | 20050 | 2003 | 0.343 | 0.6908 | Yes | ||
| 35 | ORC5L | 11173 3595 | 2023 | 0.336 | 0.6981 | Yes | ||
| 36 | TERF2 | 18756 | 2185 | 0.287 | 0.6965 | Yes | ||
| 37 | MUTYH | 2400 7693 | 2190 | 0.283 | 0.7033 | Yes | ||
| 38 | RFC3 | 12786 | 2294 | 0.254 | 0.7040 | Yes | ||
| 39 | RBMS1 | 14580 | 2663 | 0.162 | 0.6881 | No | ||
| 40 | MSH3 | 5119 | 2697 | 0.157 | 0.6902 | No | ||
| 41 | EGF | 15169 | 3113 | 0.092 | 0.6701 | No | ||
| 42 | MYST2 | 20283 | 3128 | 0.091 | 0.6716 | No | ||
| 43 | NAP1L1 | 19882 3427 330 9485 5193 | 3830 | 0.044 | 0.6348 | No | ||
| 44 | TERF2IP | 12184 18463 7167 | 3930 | 0.040 | 0.6305 | No | ||
| 45 | KIN | 15120 | 4081 | 0.035 | 0.6233 | No | ||
| 46 | CDC6 | 6221 6220 | 4092 | 0.035 | 0.6236 | No | ||
| 47 | PMS1 | 13958 | 4113 | 0.034 | 0.6233 | No | ||
| 48 | NF2 | 1222 5166 | 4275 | 0.030 | 0.6154 | No | ||
| 49 | ABL1 | 2693 4301 2794 | 4331 | 0.029 | 0.6132 | No | ||
| 50 | ORC4L | 11172 6460 | 4586 | 0.024 | 0.6001 | No | ||
| 51 | GLI2 | 13859 | 5007 | 0.019 | 0.5779 | No | ||
| 52 | RAD51 | 2897 14903 | 5053 | 0.018 | 0.5759 | No | ||
| 53 | NBN | 2485 16268 2408 | 5111 | 0.017 | 0.5732 | No | ||
| 54 | NUP98 | 17726 | 5728 | 0.012 | 0.5403 | No | ||
| 55 | CDC45L | 22642 1752 | 6572 | 0.008 | 0.4950 | No | ||
| 56 | EREG | 4679 16797 | 6651 | 0.008 | 0.4910 | No | ||
| 57 | SET | 7070 | 6744 | 0.008 | 0.4862 | No | ||
| 58 | TFAM | 19739 3330 | 6924 | 0.007 | 0.4767 | No | ||
| 59 | MCM3AP | 19981 | 7343 | 0.006 | 0.4543 | No | ||
| 60 | POT1 | 17201 | 7423 | 0.005 | 0.4502 | No | ||
| 61 | POLE2 | 21053 | 7815 | 0.004 | 0.4292 | No | ||
| 62 | HMGB2 | 13594 | 8195 | 0.003 | 0.4088 | No | ||
| 63 | IGF1 | 3352 9156 3409 | 8900 | 0.001 | 0.3709 | No | ||
| 64 | GLI1 | 19605 | 9456 | 0.000 | 0.3409 | No | ||
| 65 | POLA1 | 24112 | 9653 | -0.000 | 0.3304 | No | ||
| 66 | ACHE | 16665 | 9760 | -0.001 | 0.3247 | No | ||
| 67 | PURA | 9670 | 10677 | -0.003 | 0.2753 | No | ||
| 68 | WRNIP1 | 21675 3161 | 13217 | -0.013 | 0.1386 | No | ||
| 69 | IGHMBP2 | 23945 | 13837 | -0.019 | 0.1057 | No | ||
| 70 | TINF2 | 11381 | 14383 | -0.028 | 0.0770 | No | ||
| 71 | RAD9A | 913 3674 910 23958 | 14676 | -0.036 | 0.0621 | No | ||
| 72 | ORC2L | 385 13949 | 15052 | -0.049 | 0.0431 | No | ||
| 73 | EXO1 | 14035 4135 | 15098 | -0.051 | 0.0419 | No | ||
| 74 | RAD50 | 1198 20460 | 15509 | -0.079 | 0.0218 | No | ||
| 75 | RAD17 | 21366 | 15520 | -0.080 | 0.0232 | No | ||
| 76 | ORC3L | 6941 | 15682 | -0.094 | 0.0168 | No | ||
| 77 | ORC1L | 327 16144 | 15713 | -0.097 | 0.0176 | No | ||
| 78 | MSH5 | 23010 1599 | 15846 | -0.112 | 0.0132 | No | ||
| 79 | TBRG1 | 3119 19174 | 15901 | -0.120 | 0.0133 | No | ||
| 80 | REPIN1 | 12220 | 16787 | -0.344 | -0.0260 | No | ||
| 81 | POLD1 | 17847 | 16839 | -0.368 | -0.0197 | No | ||
| 82 | POLB | 9599 | 17312 | -0.551 | -0.0315 | No | ||
| 83 | POLD4 | 12822 | 18404 | -1.867 | -0.0443 | No | ||
| 84 | CDKN2D | 19210 | 18474 | -2.258 | 0.0077 | No |