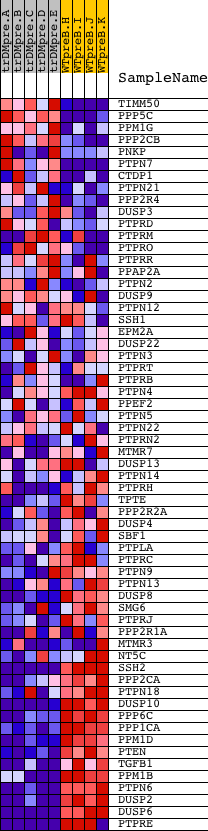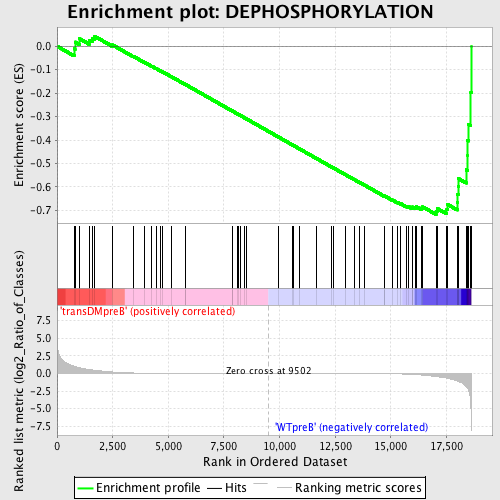
Profile of the Running ES Score & Positions of GeneSet Members on the Rank Ordered List
| Dataset | Set_04_transDMpreB_versus_WTpreB.phenotype_transDMpreB_versus_WTpreB.cls #transDMpreB_versus_WTpreB |
| Phenotype | phenotype_transDMpreB_versus_WTpreB.cls#transDMpreB_versus_WTpreB |
| Upregulated in class | WTpreB |
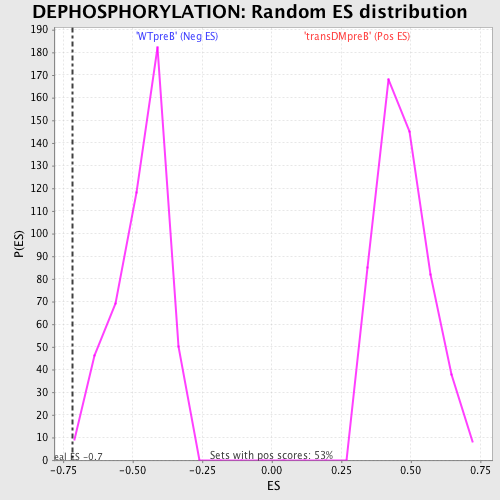
| GeneSet | DEPHOSPHORYLATION |
| Enrichment Score (ES) | -0.7172814 |
| Normalized Enrichment Score (NES) | -1.5322508 |
| Nominal p-value | 0.004219409 |
| FDR q-value | 0.32511187 |
| FWER p-Value | 0.941 |
| PROBE | DESCRIPTION (from dataset) | GENE SYMBOL | GENE_TITLE | RANK IN GENE LIST | RANK METRIC SCORE | RUNNING ES | CORE ENRICHMENT | |
|---|---|---|---|---|---|---|---|---|
| 1 | TIMM50 | 17911 | 768 | 1.015 | -0.0099 | No | ||
| 2 | PPP5C | 17952 | 808 | 0.973 | 0.0182 | No | ||
| 3 | PPM1G | 16571 | 1017 | 0.794 | 0.0316 | No | ||
| 4 | PPP2CB | 18636 | 1439 | 0.553 | 0.0260 | No | ||
| 5 | PNKP | 4052 18258 | 1577 | 0.500 | 0.0342 | No | ||
| 6 | PTPN7 | 11500 | 1675 | 0.461 | 0.0432 | No | ||
| 7 | CTDP1 | 23399 1969 | 2488 | 0.199 | 0.0056 | No | ||
| 8 | PTPN21 | 21009 | 3417 | 0.065 | -0.0424 | No | ||
| 9 | PPP2R4 | 15050 2910 | 3926 | 0.040 | -0.0685 | No | ||
| 10 | DUSP3 | 1358 13022 | 4257 | 0.031 | -0.0853 | No | ||
| 11 | PTPRD | 11554 5330 | 4447 | 0.027 | -0.0947 | No | ||
| 12 | PTPRM | 22904 | 4657 | 0.023 | -0.1052 | No | ||
| 13 | PTPRO | 1093 17256 | 4749 | 0.022 | -0.1094 | No | ||
| 14 | PTPRR | 3436 19876 | 5135 | 0.017 | -0.1297 | No | ||
| 15 | PPAP2A | 21562 3258 3244 | 5758 | 0.012 | -0.1628 | No | ||
| 16 | PTPN2 | 23414 | 5771 | 0.012 | -0.1631 | No | ||
| 17 | DUSP9 | 24307 | 7864 | 0.004 | -0.2757 | No | ||
| 18 | PTPN12 | 16597 3502 3586 3665 | 7873 | 0.004 | -0.2760 | No | ||
| 19 | SSH1 | 10540 | 8097 | 0.004 | -0.2879 | No | ||
| 20 | EPM2A | 20090 | 8152 | 0.003 | -0.2907 | No | ||
| 21 | DUSP22 | 466 21680 | 8257 | 0.003 | -0.2962 | No | ||
| 22 | PTPN3 | 9661 | 8442 | 0.003 | -0.3060 | No | ||
| 23 | PTPRT | 5333 | 8523 | 0.002 | -0.3103 | No | ||
| 24 | PTPRB | 19875 | 9952 | -0.001 | -0.3872 | No | ||
| 25 | PTPN4 | 13856 | 10562 | -0.003 | -0.4199 | No | ||
| 26 | PPEF2 | 16481 | 10613 | -0.003 | -0.4225 | No | ||
| 27 | PTPN5 | 17817 | 10905 | -0.004 | -0.4381 | No | ||
| 28 | PTPN22 | 1775 15470 | 11642 | -0.006 | -0.4776 | No | ||
| 29 | PTPRN2 | 9666 | 12316 | -0.008 | -0.5136 | No | ||
| 30 | MTMR7 | 12032 | 12400 | -0.009 | -0.5178 | No | ||
| 31 | DUSP13 | 21904 | 12976 | -0.012 | -0.5484 | No | ||
| 32 | PTPN14 | 14012 | 13380 | -0.015 | -0.5697 | No | ||
| 33 | PTPRH | 11861 | 13586 | -0.017 | -0.5802 | No | ||
| 34 | TPTE | 3875 3866 10615 3777 | 13825 | -0.019 | -0.5925 | No | ||
| 35 | PPP2R2A | 3222 21774 | 14700 | -0.036 | -0.6384 | No | ||
| 36 | DUSP4 | 18632 3820 | 14717 | -0.037 | -0.6382 | No | ||
| 37 | SBF1 | 13420 | 15066 | -0.050 | -0.6554 | No | ||
| 38 | PTPLA | 11403 6636 14680 | 15309 | -0.062 | -0.6665 | No | ||
| 39 | PTPRC | 5327 9662 | 15455 | -0.074 | -0.6720 | No | ||
| 40 | PTPN9 | 19434 | 15705 | -0.096 | -0.6825 | No | ||
| 41 | PTPN13 | 16777 | 15801 | -0.107 | -0.6843 | No | ||
| 42 | DUSP8 | 9493 | 15966 | -0.134 | -0.6890 | No | ||
| 43 | SMG6 | 119 | 15976 | -0.136 | -0.6852 | No | ||
| 44 | PTPRJ | 9664 | 16129 | -0.169 | -0.6882 | No | ||
| 45 | PPP2R1A | 11951 | 16132 | -0.169 | -0.6830 | No | ||
| 46 | MTMR3 | 7908 13193 | 16383 | -0.225 | -0.6895 | No | ||
| 47 | NT5C | 20151 | 16435 | -0.236 | -0.6849 | No | ||
| 48 | SSH2 | 6202 | 17036 | -0.443 | -0.7035 | Yes | ||
| 49 | PPP2CA | 20890 | 17081 | -0.463 | -0.6915 | Yes | ||
| 50 | PTPN18 | 14279 | 17517 | -0.665 | -0.6944 | Yes | ||
| 51 | DUSP10 | 4003 14016 | 17556 | -0.692 | -0.6750 | Yes | ||
| 52 | PPP6C | 7491 | 17988 | -1.061 | -0.6653 | Yes | ||
| 53 | PPP1CA | 9608 3756 914 909 | 18001 | -1.084 | -0.6323 | Yes | ||
| 54 | PPM1D | 20721 | 18030 | -1.116 | -0.5992 | Yes | ||
| 55 | PTEN | 5305 | 18041 | -1.135 | -0.5646 | Yes | ||
| 56 | TGFB1 | 18332 | 18387 | -1.827 | -0.5265 | Yes | ||
| 57 | PPM1B | 5280 1567 5281 | 18443 | -2.036 | -0.4663 | Yes | ||
| 58 | PTPN6 | 17002 | 18450 | -2.074 | -0.4023 | Yes | ||
| 59 | DUSP2 | 14865 | 18483 | -2.302 | -0.3327 | Yes | ||
| 60 | DUSP6 | 19891 3399 | 18597 | -4.571 | -0.1970 | Yes | ||
| 61 | PTPRE | 1662 18039 | 18614 | -6.385 | 0.0001 | Yes |