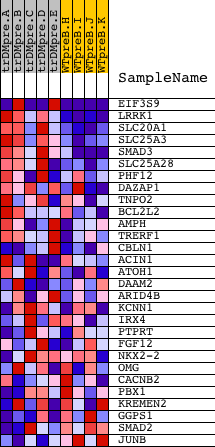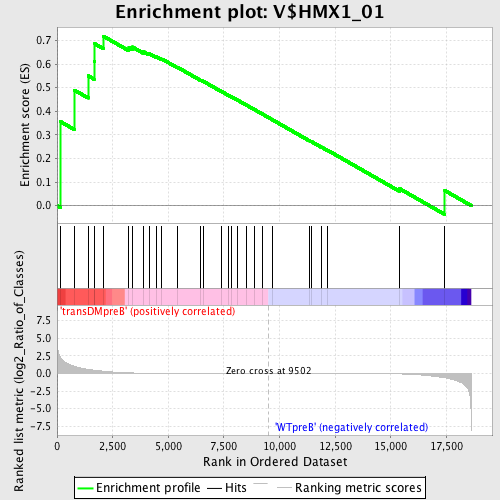
Profile of the Running ES Score & Positions of GeneSet Members on the Rank Ordered List
| Dataset | Set_04_transDMpreB_versus_WTpreB.phenotype_transDMpreB_versus_WTpreB.cls #transDMpreB_versus_WTpreB |
| Phenotype | phenotype_transDMpreB_versus_WTpreB.cls#transDMpreB_versus_WTpreB |
| Upregulated in class | transDMpreB |
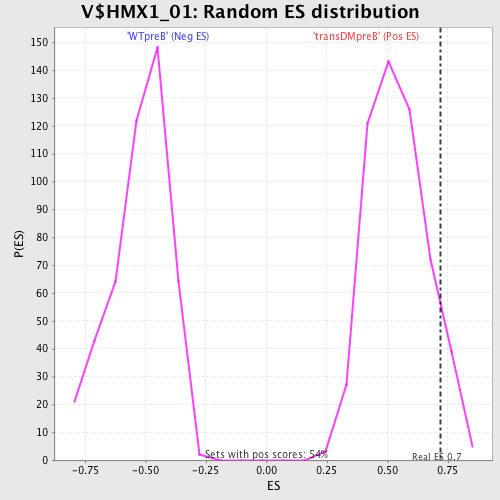
| GeneSet | V$HMX1_01 |
| Enrichment Score (ES) | 0.71842724 |
| Normalized Enrichment Score (NES) | 1.3308936 |
| Nominal p-value | 0.08395522 |
| FDR q-value | 0.4346912 |
| FWER p-Value | 1.0 |
| PROBE | DESCRIPTION (from dataset) | GENE SYMBOL | GENE_TITLE | RANK IN GENE LIST | RANK METRIC SCORE | RUNNING ES | CORE ENRICHMENT | |
|---|---|---|---|---|---|---|---|---|
| 1 | EIF3S9 | 16643 3528 | 158 | 2.211 | 0.3557 | Yes | ||
| 2 | LRRK1 | 10589 | 770 | 1.014 | 0.4899 | Yes | ||
| 3 | SLC20A1 | 14855 | 1398 | 0.571 | 0.5502 | Yes | ||
| 4 | SLC25A3 | 19644 | 1665 | 0.464 | 0.6123 | Yes | ||
| 5 | SMAD3 | 19084 | 1695 | 0.455 | 0.6857 | Yes | ||
| 6 | SLC25A28 | 23669 | 2072 | 0.321 | 0.7184 | Yes | ||
| 7 | PHF12 | 11192 6483 | 3229 | 0.080 | 0.6693 | No | ||
| 8 | DAZAP1 | 19945 | 3380 | 0.068 | 0.6725 | No | ||
| 9 | TNPO2 | 5608 | 3878 | 0.042 | 0.6527 | No | ||
| 10 | BCL2L2 | 8653 4441 | 4135 | 0.034 | 0.6445 | No | ||
| 11 | AMPH | 3256 21700 | 4459 | 0.027 | 0.6315 | No | ||
| 12 | TRERF1 | 1546 23213 | 4713 | 0.022 | 0.6215 | No | ||
| 13 | CBLN1 | 18800 | 5421 | 0.015 | 0.5859 | No | ||
| 14 | ACIN1 | 3319 2807 21832 | 6462 | 0.009 | 0.5314 | No | ||
| 15 | ATOH1 | 4419 | 6594 | 0.008 | 0.5257 | No | ||
| 16 | DAAM2 | 22945 176 | 7385 | 0.005 | 0.4841 | No | ||
| 17 | ARID4B | 21705 3233 | 7697 | 0.005 | 0.4681 | No | ||
| 18 | KCNN1 | 8200 | 7850 | 0.004 | 0.4606 | No | ||
| 19 | IRX4 | 11944 | 8121 | 0.003 | 0.4467 | No | ||
| 20 | PTPRT | 5333 | 8523 | 0.002 | 0.4255 | No | ||
| 21 | FGF12 | 1723 22621 | 8850 | 0.002 | 0.4082 | No | ||
| 22 | NKX2-2 | 5176 | 9246 | 0.001 | 0.3871 | No | ||
| 23 | OMG | 5209 | 9691 | -0.001 | 0.3633 | No | ||
| 24 | CACNB2 | 4466 8678 | 11338 | -0.005 | 0.2755 | No | ||
| 25 | PBX1 | 5224 | 11437 | -0.005 | 0.2711 | No | ||
| 26 | KREMEN2 | 23104 | 11874 | -0.007 | 0.2487 | No | ||
| 27 | GGPS1 | 3194 4776 | 12175 | -0.008 | 0.2338 | No | ||
| 28 | SMAD2 | 23511 | 15397 | -0.069 | 0.0719 | No | ||
| 29 | JUNB | 9201 | 17428 | -0.615 | 0.0639 | No |