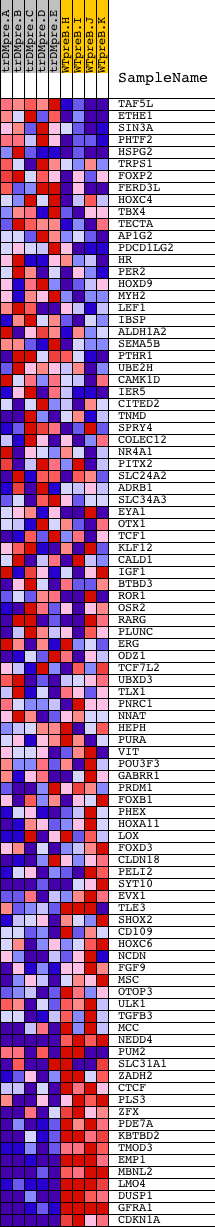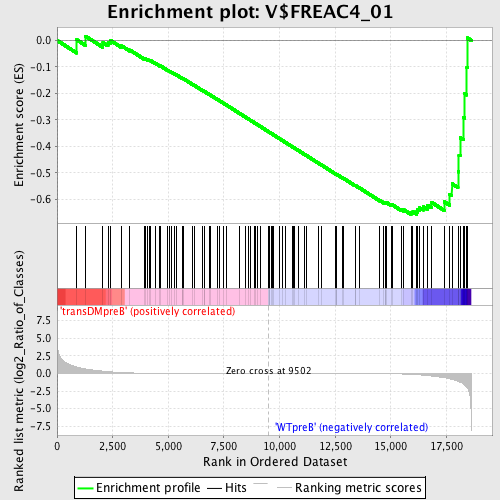
Profile of the Running ES Score & Positions of GeneSet Members on the Rank Ordered List
| Dataset | Set_04_transDMpreB_versus_WTpreB.phenotype_transDMpreB_versus_WTpreB.cls #transDMpreB_versus_WTpreB |
| Phenotype | phenotype_transDMpreB_versus_WTpreB.cls#transDMpreB_versus_WTpreB |
| Upregulated in class | WTpreB |
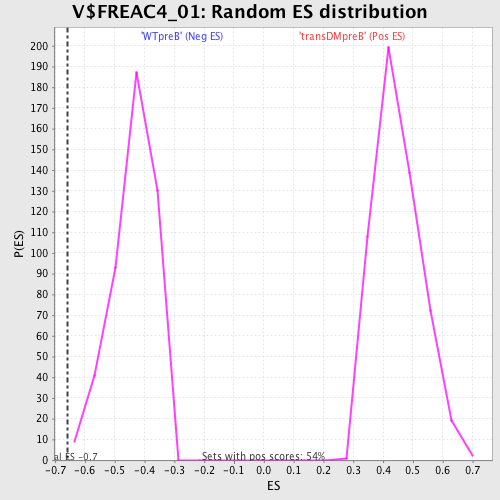
| GeneSet | V$FREAC4_01 |
| Enrichment Score (ES) | -0.65677553 |
| Normalized Enrichment Score (NES) | -1.5008057 |
| Nominal p-value | 0.004347826 |
| FDR q-value | 0.14278471 |
| FWER p-Value | 0.796 |
| PROBE | DESCRIPTION (from dataset) | GENE SYMBOL | GENE_TITLE | RANK IN GENE LIST | RANK METRIC SCORE | RUNNING ES | CORE ENRICHMENT | |
|---|---|---|---|---|---|---|---|---|
| 1 | TAF5L | 18712 | 883 | 0.907 | 0.0023 | No | ||
| 2 | ETHE1 | 18347 | 1272 | 0.631 | 0.0162 | No | ||
| 3 | SIN3A | 5442 | 2058 | 0.325 | -0.0082 | No | ||
| 4 | PHTF2 | 16599 | 2290 | 0.255 | -0.0067 | No | ||
| 5 | HSPG2 | 4884 16023 | 2413 | 0.224 | -0.0009 | No | ||
| 6 | TRPS1 | 8195 | 2903 | 0.121 | -0.0206 | No | ||
| 7 | FOXP2 | 4312 17523 8523 | 3267 | 0.076 | -0.0360 | No | ||
| 8 | FERD3L | 21292 | 3934 | 0.040 | -0.0698 | No | ||
| 9 | HOXC4 | 4864 | 3955 | 0.039 | -0.0687 | No | ||
| 10 | TBX4 | 5633 | 4080 | 0.035 | -0.0735 | No | ||
| 11 | TECTA | 19159 | 4159 | 0.033 | -0.0758 | No | ||
| 12 | AP1G2 | 2677 21827 | 4196 | 0.032 | -0.0760 | No | ||
| 13 | PDCD1LG2 | 23892 | 4415 | 0.027 | -0.0863 | No | ||
| 14 | HR | 3622 9119 | 4612 | 0.024 | -0.0955 | No | ||
| 15 | PER2 | 3940 13881 | 4652 | 0.023 | -0.0964 | No | ||
| 16 | HOXD9 | 14982 | 4971 | 0.019 | -0.1125 | No | ||
| 17 | MYH2 | 20838 | 5047 | 0.018 | -0.1155 | No | ||
| 18 | LEF1 | 1860 15420 | 5148 | 0.017 | -0.1200 | No | ||
| 19 | IBSP | 16775 | 5277 | 0.016 | -0.1260 | No | ||
| 20 | ALDH1A2 | 19386 | 5372 | 0.015 | -0.1302 | No | ||
| 21 | SEMA5B | 9801 22777 | 5632 | 0.013 | -0.1435 | No | ||
| 22 | PTHR1 | 5318 18985 | 5633 | 0.013 | -0.1428 | No | ||
| 23 | UBE2H | 5823 5822 | 5663 | 0.013 | -0.1437 | No | ||
| 24 | CAMK1D | 5977 2948 | 6084 | 0.010 | -0.1658 | No | ||
| 25 | IER5 | 13802 | 6164 | 0.010 | -0.1695 | No | ||
| 26 | CITED2 | 5118 14477 | 6512 | 0.009 | -0.1877 | No | ||
| 27 | TNMD | 24260 | 6612 | 0.008 | -0.1926 | No | ||
| 28 | SPRY4 | 23448 | 6618 | 0.008 | -0.1924 | No | ||
| 29 | COLEC12 | 23624 8946 | 6861 | 0.007 | -0.2051 | No | ||
| 30 | NR4A1 | 9099 | 6906 | 0.007 | -0.2071 | No | ||
| 31 | PITX2 | 15424 1878 | 7190 | 0.006 | -0.2220 | No | ||
| 32 | SLC24A2 | 8020 13326 8021 | 7307 | 0.006 | -0.2280 | No | ||
| 33 | ADRB1 | 4357 | 7467 | 0.005 | -0.2363 | No | ||
| 34 | SLC34A3 | 14664 | 7609 | 0.005 | -0.2436 | No | ||
| 35 | EYA1 | 4695 4061 | 8207 | 0.003 | -0.2757 | No | ||
| 36 | OTX1 | 20517 | 8461 | 0.003 | -0.2892 | No | ||
| 37 | TCF1 | 16416 | 8601 | 0.002 | -0.2966 | No | ||
| 38 | KLF12 | 4960 2637 21732 9228 | 8710 | 0.002 | -0.3023 | No | ||
| 39 | CALD1 | 4273 8463 | 8892 | 0.001 | -0.3120 | No | ||
| 40 | IGF1 | 3352 9156 3409 | 8900 | 0.001 | -0.3123 | No | ||
| 41 | BTBD3 | 10457 2975 6007 6006 | 9028 | 0.001 | -0.3191 | No | ||
| 42 | ROR1 | 6472 | 9160 | 0.001 | -0.3261 | No | ||
| 43 | OSR2 | 22492 | 9502 | -0.000 | -0.3445 | No | ||
| 44 | RARG | 22113 | 9538 | -0.000 | -0.3464 | No | ||
| 45 | PLUNC | 9593 | 9560 | -0.000 | -0.3475 | No | ||
| 46 | ERG | 1686 8915 | 9637 | -0.000 | -0.3516 | No | ||
| 47 | ODZ1 | 24168 | 9659 | -0.000 | -0.3527 | No | ||
| 48 | TCF7L2 | 10048 5646 | 9715 | -0.001 | -0.3557 | No | ||
| 49 | UBXD3 | 15701 | 10015 | -0.001 | -0.3717 | No | ||
| 50 | TLX1 | 23839 | 10118 | -0.002 | -0.3771 | No | ||
| 51 | PNRC1 | 15925 | 10244 | -0.002 | -0.3838 | No | ||
| 52 | NNAT | 2764 5180 | 10580 | -0.003 | -0.4017 | No | ||
| 53 | HEPH | 24288 2623 2635 2568 2652 | 10640 | -0.003 | -0.4048 | No | ||
| 54 | PURA | 9670 | 10677 | -0.003 | -0.4065 | No | ||
| 55 | VIT | 23155 | 10851 | -0.003 | -0.4157 | No | ||
| 56 | POU3F3 | 14261 | 11115 | -0.004 | -0.4297 | No | ||
| 57 | GABRR1 | 16250 | 11192 | -0.004 | -0.4335 | No | ||
| 58 | PRDM1 | 19775 3337 | 11758 | -0.006 | -0.4637 | No | ||
| 59 | FOXB1 | 12254 19069 | 11900 | -0.007 | -0.4709 | No | ||
| 60 | PHEX | 24024 | 12526 | -0.009 | -0.5041 | No | ||
| 61 | HOXA11 | 17146 | 12539 | -0.009 | -0.5043 | No | ||
| 62 | LOX | 23438 | 12570 | -0.010 | -0.5054 | No | ||
| 63 | FOXD3 | 9088 | 12809 | -0.011 | -0.5176 | No | ||
| 64 | CLDN18 | 19028 | 12890 | -0.011 | -0.5213 | No | ||
| 65 | PELI2 | 8217 | 13394 | -0.015 | -0.5477 | No | ||
| 66 | SYT10 | 22157 | 13421 | -0.015 | -0.5483 | No | ||
| 67 | EVX1 | 17442 | 13574 | -0.016 | -0.5556 | No | ||
| 68 | TLE3 | 5767 19416 | 14511 | -0.031 | -0.6044 | No | ||
| 69 | SHOX2 | 1802 5432 | 14688 | -0.036 | -0.6119 | No | ||
| 70 | CD109 | 6174 10656 19369 | 14770 | -0.038 | -0.6142 | No | ||
| 71 | HOXC6 | 22339 2302 | 14775 | -0.039 | -0.6123 | No | ||
| 72 | NCDN | 15756 2487 6471 | 14793 | -0.039 | -0.6110 | No | ||
| 73 | FGF9 | 8966 | 15013 | -0.048 | -0.6202 | No | ||
| 74 | MSC | 13998 | 15064 | -0.050 | -0.6202 | No | ||
| 75 | OTOP3 | 20599 | 15484 | -0.077 | -0.6386 | No | ||
| 76 | ULK1 | 16436 | 15588 | -0.085 | -0.6394 | No | ||
| 77 | TGFB3 | 10161 | 15910 | -0.122 | -0.6500 | Yes | ||
| 78 | MCC | 552 | 15993 | -0.138 | -0.6468 | Yes | ||
| 79 | NEDD4 | 19384 3101 | 16169 | -0.177 | -0.6465 | Yes | ||
| 80 | PUM2 | 2071 8161 | 16197 | -0.184 | -0.6378 | Yes | ||
| 81 | SLC31A1 | 2447 16195 | 16295 | -0.205 | -0.6317 | Yes | ||
| 82 | ZADH2 | 23501 | 16450 | -0.240 | -0.6268 | Yes | ||
| 83 | CTCF | 18490 | 16654 | -0.300 | -0.6212 | Yes | ||
| 84 | PLS3 | 8332 | 16817 | -0.358 | -0.6102 | Yes | ||
| 85 | ZFX | 5984 | 17401 | -0.596 | -0.6088 | Yes | ||
| 86 | PDE7A | 9544 1788 | 17646 | -0.750 | -0.5806 | Yes | ||
| 87 | KBTBD2 | 17137 | 17749 | -0.823 | -0.5407 | Yes | ||
| 88 | TMOD3 | 6945 | 18021 | -1.103 | -0.4945 | Yes | ||
| 89 | EMP1 | 17260 | 18061 | -1.160 | -0.4326 | Yes | ||
| 90 | MBNL2 | 21932 | 18117 | -1.242 | -0.3671 | Yes | ||
| 91 | LMO4 | 15151 | 18276 | -1.537 | -0.2909 | Yes | ||
| 92 | DUSP1 | 23061 | 18323 | -1.672 | -0.2011 | Yes | ||
| 93 | GFRA1 | 9015 | 18417 | -1.911 | -0.1007 | Yes | ||
| 94 | CDKN1A | 4511 8729 | 18439 | -2.021 | 0.0096 | Yes |