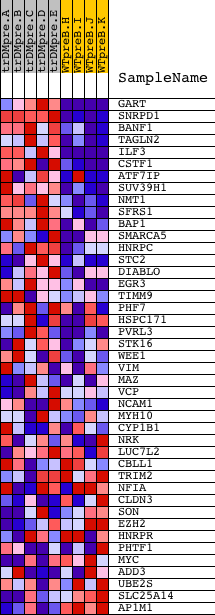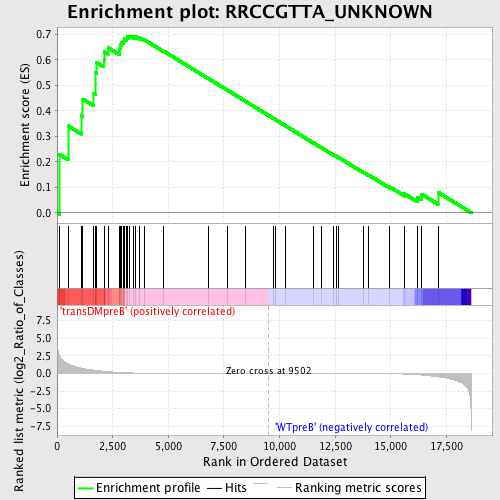
Profile of the Running ES Score & Positions of GeneSet Members on the Rank Ordered List
| Dataset | Set_04_transDMpreB_versus_WTpreB.phenotype_transDMpreB_versus_WTpreB.cls #transDMpreB_versus_WTpreB |
| Phenotype | phenotype_transDMpreB_versus_WTpreB.cls#transDMpreB_versus_WTpreB |
| Upregulated in class | transDMpreB |
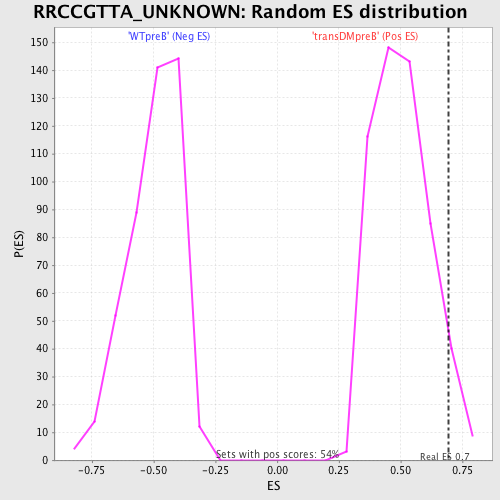
| GeneSet | RRCCGTTA_UNKNOWN |
| Enrichment Score (ES) | 0.69286674 |
| Normalized Enrichment Score (NES) | 1.3707644 |
| Nominal p-value | 0.06433824 |
| FDR q-value | 0.7231575 |
| FWER p-Value | 1.0 |
| PROBE | DESCRIPTION (from dataset) | GENE SYMBOL | GENE_TITLE | RANK IN GENE LIST | RANK METRIC SCORE | RUNNING ES | CORE ENRICHMENT | |
|---|---|---|---|---|---|---|---|---|
| 1 | GART | 22543 1754 | 121 | 2.400 | 0.2283 | Yes | ||
| 2 | SNRPD1 | 23622 | 497 | 1.354 | 0.3406 | Yes | ||
| 3 | BANF1 | 6216 10706 3760 | 1090 | 0.740 | 0.3811 | Yes | ||
| 4 | TAGLN2 | 14043 | 1159 | 0.698 | 0.4457 | Yes | ||
| 5 | ILF3 | 3110 3030 9176 | 1627 | 0.481 | 0.4677 | Yes | ||
| 6 | CSTF1 | 12515 | 1719 | 0.448 | 0.5066 | Yes | ||
| 7 | ATF7IP | 12028 13038 | 1720 | 0.448 | 0.5505 | Yes | ||
| 8 | SUV39H1 | 24194 | 1774 | 0.430 | 0.5897 | Yes | ||
| 9 | NMT1 | 20638 | 2107 | 0.310 | 0.6021 | Yes | ||
| 10 | SFRS1 | 8492 | 2114 | 0.308 | 0.6319 | Yes | ||
| 11 | BAP1 | 22057 | 2288 | 0.255 | 0.6476 | Yes | ||
| 12 | SMARCA5 | 8215 | 2797 | 0.139 | 0.6339 | Yes | ||
| 13 | HNRPC | 9102 4859 | 2822 | 0.135 | 0.6457 | Yes | ||
| 14 | STC2 | 5526 | 2832 | 0.132 | 0.6582 | Yes | ||
| 15 | DIABLO | 16375 | 2875 | 0.125 | 0.6682 | Yes | ||
| 16 | EGR3 | 4656 | 2984 | 0.108 | 0.6730 | Yes | ||
| 17 | TIMM9 | 19686 | 3007 | 0.107 | 0.6822 | Yes | ||
| 18 | PHF7 | 21890 | 3121 | 0.091 | 0.6851 | Yes | ||
| 19 | HSPC171 | 18494 | 3177 | 0.085 | 0.6905 | Yes | ||
| 20 | PVRL3 | 1674 22579 1675 | 3272 | 0.076 | 0.6929 | Yes | ||
| 21 | STK16 | 14216 | 3444 | 0.063 | 0.6898 | No | ||
| 22 | WEE1 | 18127 | 3528 | 0.057 | 0.6910 | No | ||
| 23 | VIM | 80 | 3715 | 0.048 | 0.6857 | No | ||
| 24 | MAZ | 1327 17623 | 3923 | 0.040 | 0.6785 | No | ||
| 25 | VCP | 11254 | 4796 | 0.021 | 0.6336 | No | ||
| 26 | NCAM1 | 5149 | 6811 | 0.007 | 0.5259 | No | ||
| 27 | MYH10 | 8077 | 7678 | 0.005 | 0.4798 | No | ||
| 28 | CYP1B1 | 4581 | 8475 | 0.003 | 0.4372 | No | ||
| 29 | NRK | 6559 | 9713 | -0.001 | 0.3706 | No | ||
| 30 | LUC7L2 | 5313 5312 | 9795 | -0.001 | 0.3663 | No | ||
| 31 | CBLL1 | 4188 | 10257 | -0.002 | 0.3417 | No | ||
| 32 | TRIM2 | 13485 8157 | 11527 | -0.005 | 0.2739 | No | ||
| 33 | NFIA | 16172 5170 | 11867 | -0.006 | 0.2563 | No | ||
| 34 | CLDN3 | 16680 | 12420 | -0.009 | 0.2274 | No | ||
| 35 | SON | 5473 1657 1684 | 12555 | -0.010 | 0.2211 | No | ||
| 36 | EZH2 | 1092 17163 | 12637 | -0.010 | 0.2177 | No | ||
| 37 | HNRPR | 13196 7909 2500 | 13777 | -0.019 | 0.1582 | No | ||
| 38 | PHTF1 | 15469 | 14012 | -0.022 | 0.1478 | No | ||
| 39 | MYC | 22465 9435 | 14956 | -0.045 | 0.1014 | No | ||
| 40 | ADD3 | 23812 3694 | 15619 | -0.088 | 0.0744 | No | ||
| 41 | UBE2S | 17979 | 16189 | -0.183 | 0.0616 | No | ||
| 42 | SLC25A14 | 24344 | 16386 | -0.226 | 0.0732 | No | ||
| 43 | AP1M1 | 18571 | 17124 | -0.478 | 0.0803 | No |