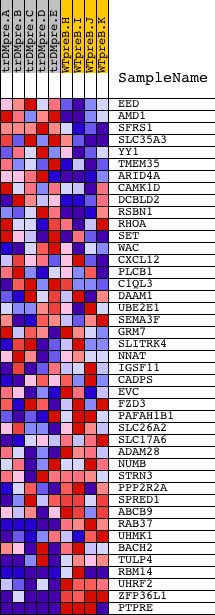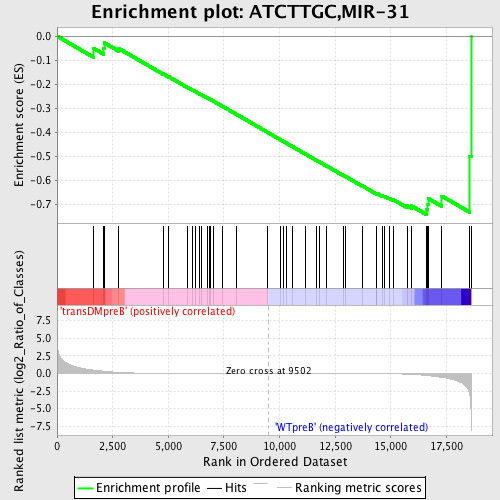
Profile of the Running ES Score & Positions of GeneSet Members on the Rank Ordered List
| Dataset | Set_04_transDMpreB_versus_WTpreB.phenotype_transDMpreB_versus_WTpreB.cls #transDMpreB_versus_WTpreB |
| Phenotype | phenotype_transDMpreB_versus_WTpreB.cls#transDMpreB_versus_WTpreB |
| Upregulated in class | WTpreB |
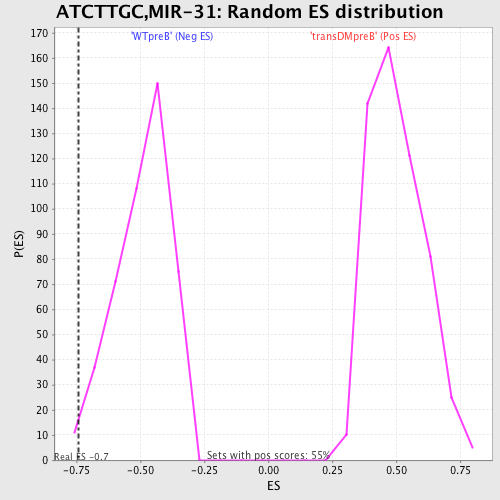
| GeneSet | ATCTTGC,MIR-31 |
| Enrichment Score (ES) | -0.742766 |
| Normalized Enrichment Score (NES) | -1.5134507 |
| Nominal p-value | 0.0088495575 |
| FDR q-value | 0.15238477 |
| FWER p-Value | 0.734 |
| PROBE | DESCRIPTION (from dataset) | GENE SYMBOL | GENE_TITLE | RANK IN GENE LIST | RANK METRIC SCORE | RUNNING ES | CORE ENRICHMENT | |
|---|---|---|---|---|---|---|---|---|
| 1 | EED | 17759 | 1632 | 0.478 | -0.0502 | No | ||
| 2 | AMD1 | 8583 | 2095 | 0.314 | -0.0504 | No | ||
| 3 | SFRS1 | 8492 | 2114 | 0.308 | -0.0271 | No | ||
| 4 | SLC35A3 | 6038 | 2779 | 0.142 | -0.0517 | No | ||
| 5 | YY1 | 10371 | 4772 | 0.022 | -0.1572 | No | ||
| 6 | TMEM35 | 24255 | 5026 | 0.018 | -0.1694 | No | ||
| 7 | ARID4A | 2080 6215 | 5859 | 0.012 | -0.2133 | No | ||
| 8 | CAMK1D | 5977 2948 | 6084 | 0.010 | -0.2245 | No | ||
| 9 | DCBLD2 | 7855 | 6198 | 0.010 | -0.2298 | No | ||
| 10 | RSBN1 | 6035 | 6420 | 0.009 | -0.2410 | No | ||
| 11 | RHOA | 8624 4409 4410 | 6499 | 0.009 | -0.2445 | No | ||
| 12 | SET | 7070 | 6744 | 0.008 | -0.2571 | No | ||
| 13 | WAC | 5905 5906 | 6841 | 0.007 | -0.2617 | No | ||
| 14 | CXCL12 | 9792 1182 1031 | 6882 | 0.007 | -0.2632 | No | ||
| 15 | PLCB1 | 14832 2821 | 7050 | 0.007 | -0.2717 | No | ||
| 16 | C1QL3 | 14684 | 7437 | 0.005 | -0.2921 | No | ||
| 17 | DAAM1 | 5536 | 8049 | 0.004 | -0.3247 | No | ||
| 18 | UBE2E1 | 10243 5817 | 9454 | 0.000 | -0.4003 | No | ||
| 19 | SEMA3F | 18999 3097 | 10060 | -0.001 | -0.4327 | No | ||
| 20 | GRM7 | 17338 | 10179 | -0.002 | -0.4389 | No | ||
| 21 | SLITRK4 | 24144 | 10301 | -0.002 | -0.4453 | No | ||
| 22 | NNAT | 2764 5180 | 10580 | -0.003 | -0.4601 | No | ||
| 23 | IGSF11 | 9877 22755 | 11154 | -0.004 | -0.4906 | No | ||
| 24 | CADPS | 11298 | 11656 | -0.006 | -0.5171 | No | ||
| 25 | EVC | 7206 | 11811 | -0.006 | -0.5249 | No | ||
| 26 | FZD3 | 21784 | 12091 | -0.007 | -0.5393 | No | ||
| 27 | PAFAH1B1 | 1340 5220 9524 | 12851 | -0.011 | -0.5793 | No | ||
| 28 | SLC26A2 | 23427 | 12978 | -0.012 | -0.5852 | No | ||
| 29 | SLC17A6 | 18226 | 13708 | -0.018 | -0.6230 | No | ||
| 30 | ADAM28 | 3484 8868 4645 3113 | 14354 | -0.028 | -0.6556 | No | ||
| 31 | NUMB | 5202 2146 2054 | 14361 | -0.028 | -0.6537 | No | ||
| 32 | STRN3 | 884 21074 | 14623 | -0.034 | -0.6651 | No | ||
| 33 | PPP2R2A | 3222 21774 | 14700 | -0.036 | -0.6664 | No | ||
| 34 | SPRED1 | 4331 | 14919 | -0.044 | -0.6747 | No | ||
| 35 | ABCB9 | 3576 3546 7096 | 15105 | -0.051 | -0.6806 | No | ||
| 36 | RAB37 | 20602 | 15743 | -0.101 | -0.7070 | No | ||
| 37 | UHMK1 | 4038 4957 | 15929 | -0.126 | -0.7070 | No | ||
| 38 | BACH2 | 8648 | 16595 | -0.285 | -0.7204 | Yes | ||
| 39 | TULP4 | 12740 | 16667 | -0.305 | -0.7002 | Yes | ||
| 40 | RBM14 | 3673 12087 | 16698 | -0.316 | -0.6769 | Yes | ||
| 41 | UHRF2 | 3731 4262 8452 23887 | 17296 | -0.545 | -0.6661 | Yes | ||
| 42 | ZFP36L1 | 4453 4454 | 18552 | -2.980 | -0.4992 | Yes | ||
| 43 | PTPRE | 1662 18039 | 18614 | -6.385 | 0.0001 | Yes |