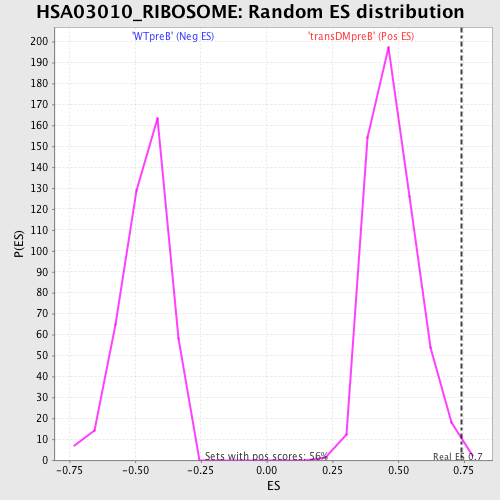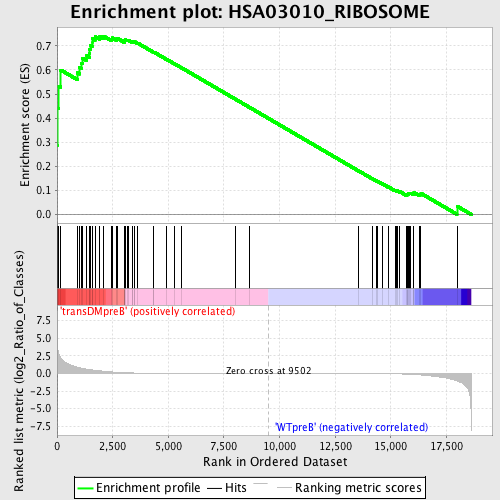
Profile of the Running ES Score & Positions of GeneSet Members on the Rank Ordered List
| Dataset | Set_04_transDMpreB_versus_WTpreB.phenotype_transDMpreB_versus_WTpreB.cls #transDMpreB_versus_WTpreB |
| Phenotype | phenotype_transDMpreB_versus_WTpreB.cls#transDMpreB_versus_WTpreB |
| Upregulated in class | transDMpreB |
| GeneSet | HSA03010_RIBOSOME |
| Enrichment Score (ES) | 0.7406224 |
| Normalized Enrichment Score (NES) | 1.5478101 |
| Nominal p-value | 0.005319149 |
| FDR q-value | 0.15132448 |
| FWER p-Value | 0.535 |
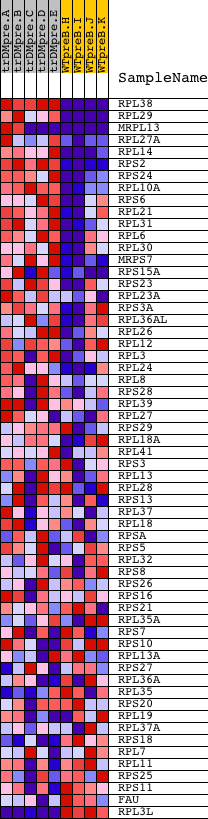
| PROBE | DESCRIPTION (from dataset) | GENE SYMBOL | GENE_TITLE | RANK IN GENE LIST | RANK METRIC SCORE | RUNNING ES | CORE ENRICHMENT | |
|---|---|---|---|---|---|---|---|---|
| 1 | RPL38 | 12562 20606 7475 | 0 | 8.861 | 0.2884 | Yes | ||
| 2 | RPL29 | 9741 | 9 | 4.712 | 0.4414 | Yes | ||
| 3 | MRPL13 | 2249 22294 | 70 | 2.924 | 0.5334 | Yes | ||
| 4 | RPL27A | 11181 6467 18130 | 165 | 2.198 | 0.5998 | Yes | ||
| 5 | RPL14 | 19267 | 917 | 0.881 | 0.5881 | Yes | ||
| 6 | RPS2 | 9279 | 1009 | 0.800 | 0.6092 | Yes | ||
| 7 | RPS24 | 5399 | 1091 | 0.739 | 0.6289 | Yes | ||
| 8 | RPL10A | 9735 | 1137 | 0.712 | 0.6497 | Yes | ||
| 9 | RPS6 | 9757 | 1335 | 0.604 | 0.6587 | Yes | ||
| 10 | RPL21 | 9737 16624 5391 | 1458 | 0.544 | 0.6699 | Yes | ||
| 11 | RPL31 | 14267 | 1469 | 0.541 | 0.6869 | Yes | ||
| 12 | RPL6 | 9747 | 1509 | 0.525 | 0.7019 | Yes | ||
| 13 | RPL30 | 9742 | 1576 | 0.501 | 0.7147 | Yes | ||
| 14 | MRPS7 | 20595 | 1580 | 0.499 | 0.7307 | Yes | ||
| 15 | RPS15A | 6476 | 1706 | 0.453 | 0.7387 | Yes | ||
| 16 | RPS23 | 12352 | 1919 | 0.370 | 0.7394 | Yes | ||
| 17 | RPL23A | 11193 | 2088 | 0.316 | 0.7406 | Yes | ||
| 18 | RPS3A | 9755 | 2442 | 0.215 | 0.7286 | No | ||
| 19 | RPL36AL | 12357 | 2479 | 0.202 | 0.7333 | No | ||
| 20 | RPL26 | 9739 | 2669 | 0.162 | 0.7284 | No | ||
| 21 | RPL12 | 11243 | 2711 | 0.155 | 0.7312 | No | ||
| 22 | RPL3 | 11330 | 3017 | 0.105 | 0.7182 | No | ||
| 23 | RPL24 | 12664 | 3030 | 0.103 | 0.7209 | No | ||
| 24 | RPL8 | 22437 | 3042 | 0.101 | 0.7236 | No | ||
| 25 | RPS28 | 12009 | 3063 | 0.098 | 0.7257 | No | ||
| 26 | RPL39 | 12496 | 3151 | 0.088 | 0.7239 | No | ||
| 27 | RPL27 | 9740 | 3193 | 0.083 | 0.7243 | No | ||
| 28 | RPS29 | 9754 | 3372 | 0.069 | 0.7170 | No | ||
| 29 | RPL18A | 13358 | 3402 | 0.066 | 0.7176 | No | ||
| 30 | RPL41 | 12611 | 3459 | 0.062 | 0.7166 | No | ||
| 31 | RPS3 | 6549 11295 | 3474 | 0.061 | 0.7178 | No | ||
| 32 | RPL13 | 11284 | 3615 | 0.053 | 0.7120 | No | ||
| 33 | RPL28 | 5392 | 4339 | 0.029 | 0.6740 | No | ||
| 34 | RPS13 | 12633 | 4353 | 0.029 | 0.6742 | No | ||
| 35 | RPL37 | 12502 7421 22521 | 4926 | 0.020 | 0.6440 | No | ||
| 36 | RPL18 | 450 5390 | 5260 | 0.016 | 0.6266 | No | ||
| 37 | RPSA | 19270 4984 | 5603 | 0.013 | 0.6086 | No | ||
| 38 | RPS5 | 18391 | 8030 | 0.004 | 0.4780 | No | ||
| 39 | RPL32 | 9743 | 8626 | 0.002 | 0.4460 | No | ||
| 40 | RPS8 | 9761 | 13563 | -0.016 | 0.1805 | No | ||
| 41 | RPS26 | 11331 | 14176 | -0.025 | 0.1483 | No | ||
| 42 | RPS16 | 9752 | 14362 | -0.028 | 0.1393 | No | ||
| 43 | RPS21 | 12356 | 14399 | -0.028 | 0.1383 | No | ||
| 44 | RPL35A | 12194 | 14608 | -0.033 | 0.1281 | No | ||
| 45 | RPS7 | 9760 | 14888 | -0.043 | 0.1145 | No | ||
| 46 | RPS10 | 12464 | 15187 | -0.055 | 0.1002 | No | ||
| 47 | RPL13A | 10226 79 | 15259 | -0.059 | 0.0983 | No | ||
| 48 | RPS27 | 12183 | 15287 | -0.061 | 0.0989 | No | ||
| 49 | RPL36A | 9745 | 15410 | -0.070 | 0.0946 | No | ||
| 50 | RPL35 | 12360 | 15718 | -0.097 | 0.0812 | No | ||
| 51 | RPS20 | 7438 | 15729 | -0.098 | 0.0838 | No | ||
| 52 | RPL19 | 9736 | 15770 | -0.103 | 0.0850 | No | ||
| 53 | RPL37A | 9744 | 15784 | -0.105 | 0.0878 | No | ||
| 54 | RPS18 | 1529 5397 1603 | 15825 | -0.109 | 0.0892 | No | ||
| 55 | RPL7 | 9748 | 15898 | -0.119 | 0.0892 | No | ||
| 56 | RPL11 | 12450 | 16025 | -0.143 | 0.0870 | No | ||
| 57 | RPS25 | 13270 | 16038 | -0.145 | 0.0911 | No | ||
| 58 | RPS11 | 11317 | 16274 | -0.200 | 0.0850 | No | ||
| 59 | FAU | 8954 | 16354 | -0.219 | 0.0878 | No | ||
| 60 | RPL3L | 23354 | 17976 | -1.044 | 0.0345 | No |