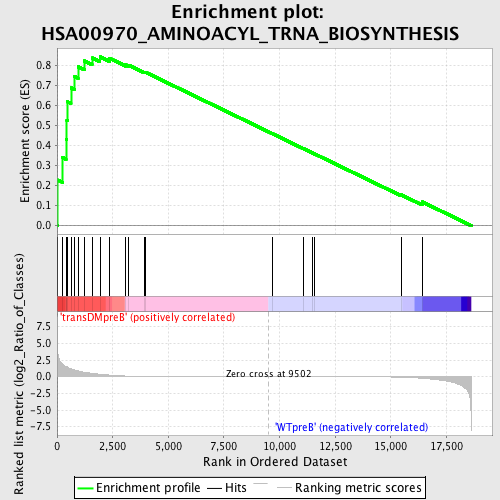
Profile of the Running ES Score & Positions of GeneSet Members on the Rank Ordered List
| Dataset | Set_04_transDMpreB_versus_WTpreB.phenotype_transDMpreB_versus_WTpreB.cls #transDMpreB_versus_WTpreB |
| Phenotype | phenotype_transDMpreB_versus_WTpreB.cls#transDMpreB_versus_WTpreB |
| Upregulated in class | transDMpreB |
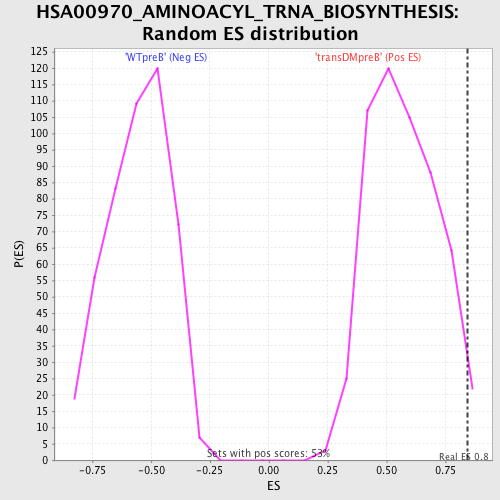
| GeneSet | HSA00970_AMINOACYL_TRNA_BIOSYNTHESIS |
| Enrichment Score (ES) | 0.84257996 |
| Normalized Enrichment Score (NES) | 1.4683261 |
| Nominal p-value | 0.026217228 |
| FDR q-value | 0.41006327 |
| FWER p-Value | 0.985 |
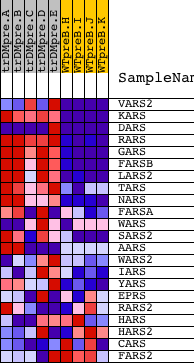
| PROBE | DESCRIPTION (from dataset) | GENE SYMBOL | GENE_TITLE | RANK IN GENE LIST | RANK METRIC SCORE | RUNNING ES | CORE ENRICHMENT | |
|---|---|---|---|---|---|---|---|---|
| 1 | VARS2 | 23265 1595 7588 | 28 | 3.447 | 0.2281 | Yes | ||
| 2 | KARS | 18738 | 243 | 1.851 | 0.3399 | Yes | ||
| 3 | DARS | 10375 13846 | 403 | 1.505 | 0.4316 | Yes | ||
| 4 | RARS | 20496 | 439 | 1.460 | 0.5270 | Yes | ||
| 5 | GARS | 17438 | 476 | 1.393 | 0.6179 | Yes | ||
| 6 | FARSB | 13909 | 625 | 1.167 | 0.6877 | Yes | ||
| 7 | LARS2 | 19255 | 792 | 0.988 | 0.7445 | Yes | ||
| 8 | TARS | 22325 8502 | 944 | 0.856 | 0.7934 | Yes | ||
| 9 | NARS | 23418 | 1225 | 0.659 | 0.8223 | Yes | ||
| 10 | FARSA | 7311 | 1572 | 0.503 | 0.8372 | Yes | ||
| 11 | WARS | 2085 20984 | 1927 | 0.367 | 0.8426 | Yes | ||
| 12 | SARS2 | 5 | 2354 | 0.239 | 0.8356 | No | ||
| 13 | AARS | 10630 6151 | 3083 | 0.096 | 0.8028 | No | ||
| 14 | WARS2 | 12884 7688 | 3218 | 0.081 | 0.8010 | No | ||
| 15 | IARS | 4190 8361 8362 | 3924 | 0.040 | 0.7658 | No | ||
| 16 | YARS | 16071 | 3986 | 0.038 | 0.7650 | No | ||
| 17 | EPRS | 14014 | 9702 | -0.001 | 0.4577 | No | ||
| 18 | RARS2 | 16247 2490 2411 | 11074 | -0.004 | 0.3843 | No | ||
| 19 | HARS | 23451 | 11461 | -0.005 | 0.3639 | No | ||
| 20 | HARS2 | 23592 14820 | 11584 | -0.006 | 0.3577 | No | ||
| 21 | CARS | 1683 17544 | 15459 | -0.074 | 0.1543 | No | ||
| 22 | FARS2 | 21666 | 16410 | -0.232 | 0.1186 | No |