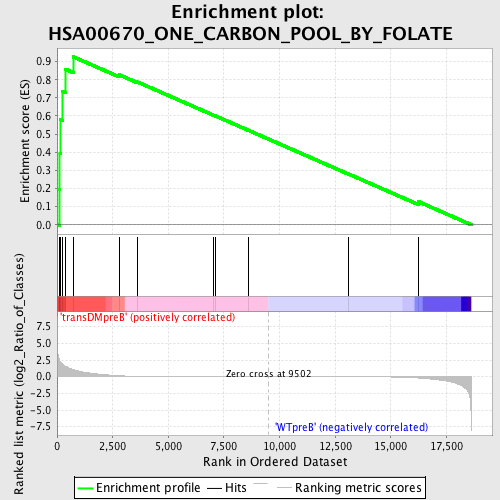
Profile of the Running ES Score & Positions of GeneSet Members on the Rank Ordered List
| Dataset | Set_04_transDMpreB_versus_WTpreB.phenotype_transDMpreB_versus_WTpreB.cls #transDMpreB_versus_WTpreB |
| Phenotype | phenotype_transDMpreB_versus_WTpreB.cls#transDMpreB_versus_WTpreB |
| Upregulated in class | transDMpreB |
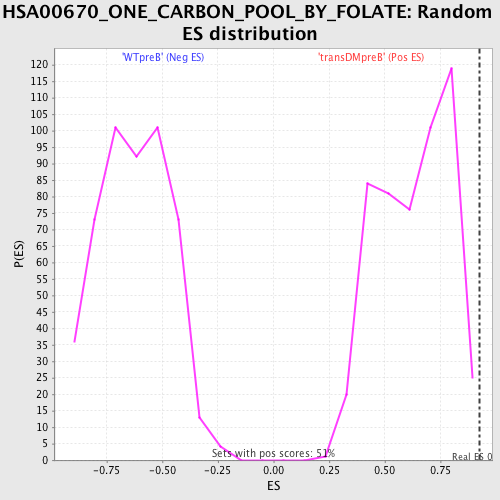
| GeneSet | HSA00670_ONE_CARBON_POOL_BY_FOLATE |
| Enrichment Score (ES) | 0.9260991 |
| Normalized Enrichment Score (NES) | 1.4722203 |
| Nominal p-value | 0.0019723866 |
| FDR q-value | 0.4461307 |
| FWER p-Value | 0.98 |
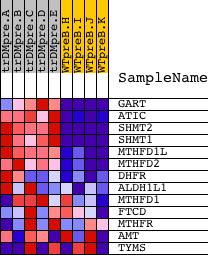
| PROBE | DESCRIPTION (from dataset) | GENE SYMBOL | GENE_TITLE | RANK IN GENE LIST | RANK METRIC SCORE | RUNNING ES | CORE ENRICHMENT | |
|---|---|---|---|---|---|---|---|---|
| 1 | GART | 22543 1754 | 121 | 2.400 | 0.1943 | Yes | ||
| 2 | ATIC | 14231 3968 | 128 | 2.362 | 0.3915 | Yes | ||
| 3 | SHMT2 | 3307 19601 | 139 | 2.281 | 0.5817 | Yes | ||
| 4 | SHMT1 | 5431 | 232 | 1.891 | 0.7350 | Yes | ||
| 5 | MTHFD1L | 11300 | 361 | 1.560 | 0.8586 | Yes | ||
| 6 | MTHFD2 | 17100 | 732 | 1.045 | 0.9261 | Yes | ||
| 7 | DHFR | 21590 | 2788 | 0.141 | 0.8274 | No | ||
| 8 | ALDH1L1 | 17358 1014 | 3613 | 0.053 | 0.7876 | No | ||
| 9 | MTHFD1 | 2132 21238 | 7037 | 0.007 | 0.6041 | No | ||
| 10 | FTCD | 3390 19979 | 7108 | 0.006 | 0.6009 | No | ||
| 11 | MTHFR | 5130 | 8586 | 0.002 | 0.5217 | No | ||
| 12 | AMT | 322 | 13098 | -0.013 | 0.2803 | No | ||
| 13 | TYMS | 5810 5809 3606 3598 | 16248 | -0.195 | 0.1273 | No |