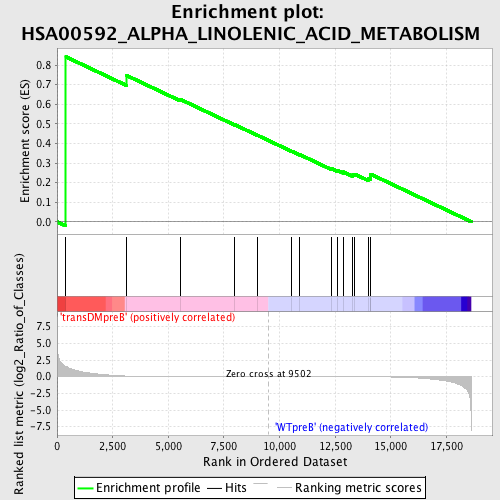
Profile of the Running ES Score & Positions of GeneSet Members on the Rank Ordered List
| Dataset | Set_04_transDMpreB_versus_WTpreB.phenotype_transDMpreB_versus_WTpreB.cls #transDMpreB_versus_WTpreB |
| Phenotype | phenotype_transDMpreB_versus_WTpreB.cls#transDMpreB_versus_WTpreB |
| Upregulated in class | transDMpreB |
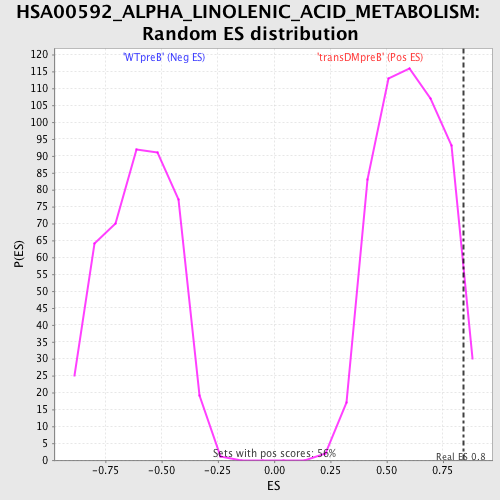
| GeneSet | HSA00592_ALPHA_LINOLENIC_ACID_METABOLISM |
| Enrichment Score (ES) | 0.8418838 |
| Normalized Enrichment Score (NES) | 1.386546 |
| Nominal p-value | 0.04812834 |
| FDR q-value | 0.471566 |
| FWER p-Value | 1.0 |
| PROBE | DESCRIPTION (from dataset) | GENE SYMBOL | GENE_TITLE | RANK IN GENE LIST | RANK METRIC SCORE | RUNNING ES | CORE ENRICHMENT | |
|---|---|---|---|---|---|---|---|---|
| 1 | PLA2G12A | 1782 7281 1839 | 398 | 1.516 | 0.8419 | Yes | ||
| 2 | PLA2G6 | 22209 | 3130 | 0.090 | 0.7465 | No | ||
| 3 | ACOX1 | 8528 1416 | 5530 | 0.014 | 0.6254 | No | ||
| 4 | PLA2G4A | 13809 | 7986 | 0.004 | 0.4956 | No | ||
| 5 | PLA2G2E | 16016 | 9015 | 0.001 | 0.4410 | No | ||
| 6 | PLA2G10 | 22658 | 10543 | -0.003 | 0.3604 | No | ||
| 7 | PLA2G12B | 20016 | 10913 | -0.004 | 0.3426 | No | ||
| 8 | PLA2G3 | 20968 | 12336 | -0.008 | 0.2709 | No | ||
| 9 | PLA2G2D | 16018 | 12613 | -0.010 | 0.2616 | No | ||
| 10 | ACOX3 | 3612 16867 | 12864 | -0.011 | 0.2545 | No | ||
| 11 | PLA2G2A | 16017 | 13294 | -0.014 | 0.2393 | No | ||
| 12 | PLA2G1B | 9581 | 13366 | -0.015 | 0.2438 | No | ||
| 13 | PLA2G2F | 15700 | 13981 | -0.021 | 0.2230 | No | ||
| 14 | FADS2 | 7127 | 14081 | -0.023 | 0.2306 | No | ||
| 15 | PLA2G5 | 9583 | 14095 | -0.023 | 0.2430 | No |