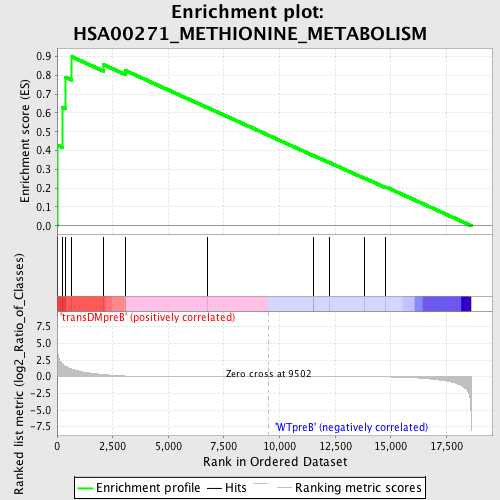
Profile of the Running ES Score & Positions of GeneSet Members on the Rank Ordered List
| Dataset | Set_04_transDMpreB_versus_WTpreB.phenotype_transDMpreB_versus_WTpreB.cls #transDMpreB_versus_WTpreB |
| Phenotype | phenotype_transDMpreB_versus_WTpreB.cls#transDMpreB_versus_WTpreB |
| Upregulated in class | transDMpreB |
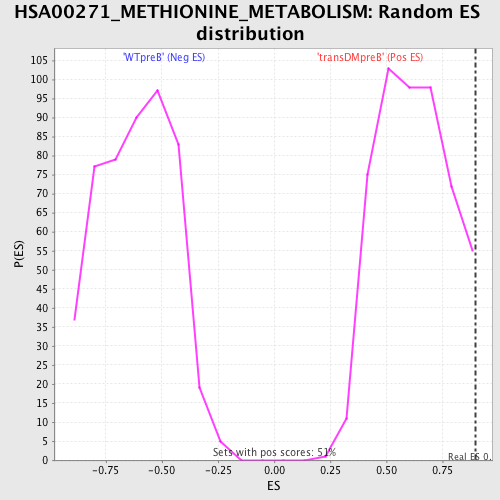
| GeneSet | HSA00271_METHIONINE_METABOLISM |
| Enrichment Score (ES) | 0.8986961 |
| Normalized Enrichment Score (NES) | 1.4401257 |
| Nominal p-value | 0.015594542 |
| FDR q-value | 0.50185317 |
| FWER p-Value | 0.998 |
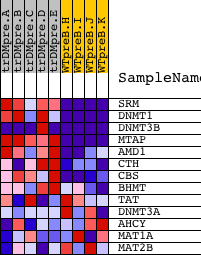
| PROBE | DESCRIPTION (from dataset) | GENE SYMBOL | GENE_TITLE | RANK IN GENE LIST | RANK METRIC SCORE | RUNNING ES | CORE ENRICHMENT | |
|---|---|---|---|---|---|---|---|---|
| 1 | SRM | 9890 2525 | 20 | 3.887 | 0.4289 | Yes | ||
| 2 | DNMT1 | 19217 | 226 | 1.914 | 0.6297 | Yes | ||
| 3 | DNMT3B | 2840 14785 | 383 | 1.531 | 0.7906 | Yes | ||
| 4 | MTAP | 16178 | 668 | 1.115 | 0.8987 | Yes | ||
| 5 | AMD1 | 8583 | 2095 | 0.314 | 0.8567 | No | ||
| 6 | CTH | 1938 15131 | 3059 | 0.098 | 0.8158 | No | ||
| 7 | CBS | 1550 23034 | 3073 | 0.097 | 0.8259 | No | ||
| 8 | BHMT | 4446 | 6773 | 0.007 | 0.6279 | No | ||
| 9 | TAT | 18468 | 11514 | -0.005 | 0.3737 | No | ||
| 10 | DNMT3A | 2167 21330 | 11521 | -0.005 | 0.3739 | No | ||
| 11 | AHCY | 6526 | 12249 | -0.008 | 0.3357 | No | ||
| 12 | MAT1A | 22041 | 13812 | -0.019 | 0.2539 | No | ||
| 13 | MAT2B | 20494 1431 | 14780 | -0.039 | 0.2062 | No |