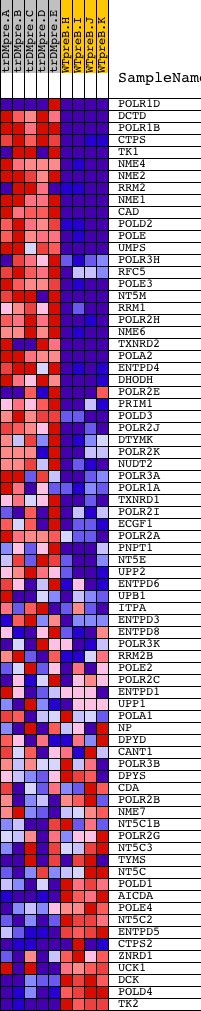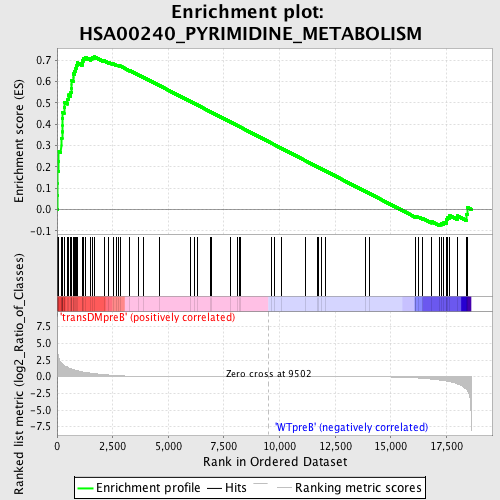
Profile of the Running ES Score & Positions of GeneSet Members on the Rank Ordered List
| Dataset | Set_04_transDMpreB_versus_WTpreB.phenotype_transDMpreB_versus_WTpreB.cls #transDMpreB_versus_WTpreB |
| Phenotype | phenotype_transDMpreB_versus_WTpreB.cls#transDMpreB_versus_WTpreB |
| Upregulated in class | transDMpreB |
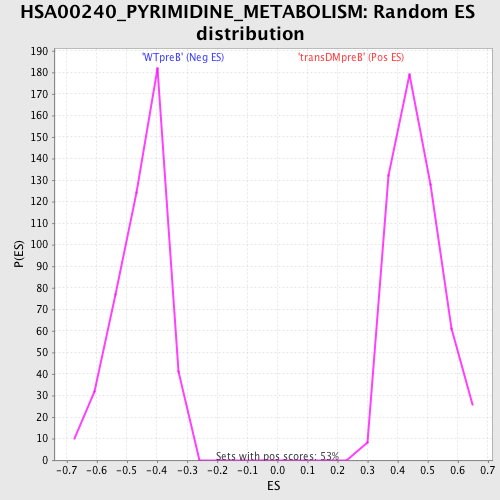
| GeneSet | HSA00240_PYRIMIDINE_METABOLISM |
| Enrichment Score (ES) | 0.7153137 |
| Normalized Enrichment Score (NES) | 1.5457274 |
| Nominal p-value | 0.0 |
| FDR q-value | 0.12721469 |
| FWER p-Value | 0.555 |
| PROBE | DESCRIPTION (from dataset) | GENE SYMBOL | GENE_TITLE | RANK IN GENE LIST | RANK METRIC SCORE | RUNNING ES | CORE ENRICHMENT | |
|---|---|---|---|---|---|---|---|---|
| 1 | POLR1D | 3593 3658 16623 | 18 | 4.063 | 0.0653 | Yes | ||
| 2 | DCTD | 18620 | 26 | 3.619 | 0.1240 | Yes | ||
| 3 | POLR1B | 14857 | 32 | 3.400 | 0.1792 | Yes | ||
| 4 | CTPS | 2514 15772 | 67 | 2.940 | 0.2253 | Yes | ||
| 5 | TK1 | 1457 10182 5762 | 78 | 2.795 | 0.2704 | Yes | ||
| 6 | NME4 | 23065 1577 | 174 | 2.127 | 0.2999 | Yes | ||
| 7 | NME2 | 9468 | 175 | 2.112 | 0.3344 | Yes | ||
| 8 | RRM2 | 5401 5400 | 222 | 1.924 | 0.3633 | Yes | ||
| 9 | NME1 | 9467 | 229 | 1.906 | 0.3941 | Yes | ||
| 10 | CAD | 16886 | 233 | 1.890 | 0.4248 | Yes | ||
| 11 | POLD2 | 20537 | 245 | 1.841 | 0.4542 | Yes | ||
| 12 | POLE | 16755 | 314 | 1.622 | 0.4770 | Yes | ||
| 13 | UMPS | 22606 1760 | 337 | 1.598 | 0.5019 | Yes | ||
| 14 | POLR3H | 13460 8135 | 481 | 1.385 | 0.5168 | Yes | ||
| 15 | RFC5 | 13005 7791 | 515 | 1.327 | 0.5366 | Yes | ||
| 16 | POLE3 | 7200 | 616 | 1.176 | 0.5504 | Yes | ||
| 17 | NT5M | 8345 4175 | 637 | 1.153 | 0.5682 | Yes | ||
| 18 | RRM1 | 18163 | 645 | 1.145 | 0.5865 | Yes | ||
| 19 | POLR2H | 10888 | 646 | 1.144 | 0.6051 | Yes | ||
| 20 | NME6 | 3139 19297 | 724 | 1.055 | 0.6182 | Yes | ||
| 21 | TXNRD2 | 22829 1649 | 725 | 1.053 | 0.6354 | Yes | ||
| 22 | POLA2 | 23988 | 781 | 1.001 | 0.6487 | Yes | ||
| 23 | ENTPD4 | 7449 | 840 | 0.939 | 0.6609 | Yes | ||
| 24 | DHODH | 7152 | 860 | 0.928 | 0.6751 | Yes | ||
| 25 | POLR2E | 3325 19699 | 901 | 0.891 | 0.6874 | Yes | ||
| 26 | PRIM1 | 19847 | 1125 | 0.723 | 0.6872 | Yes | ||
| 27 | POLD3 | 17742 | 1142 | 0.708 | 0.6979 | Yes | ||
| 28 | POLR2J | 16672 | 1186 | 0.681 | 0.7067 | Yes | ||
| 29 | DTYMK | 5776 | 1268 | 0.633 | 0.7127 | Yes | ||
| 30 | POLR2K | 9413 | 1517 | 0.524 | 0.7078 | Yes | ||
| 31 | NUDT2 | 16239 | 1570 | 0.503 | 0.7132 | Yes | ||
| 32 | POLR3A | 21900 | 1672 | 0.462 | 0.7153 | Yes | ||
| 33 | POLR1A | 9749 5393 | 2115 | 0.308 | 0.6965 | No | ||
| 34 | TXNRD1 | 19923 | 2319 | 0.249 | 0.6896 | No | ||
| 35 | POLR2I | 12839 | 2516 | 0.193 | 0.6822 | No | ||
| 36 | ECGF1 | 22160 | 2676 | 0.161 | 0.6762 | No | ||
| 37 | POLR2A | 5394 | 2747 | 0.149 | 0.6749 | No | ||
| 38 | PNPT1 | 20936 | 2830 | 0.133 | 0.6726 | No | ||
| 39 | NT5E | 19360 18702 | 3274 | 0.076 | 0.6500 | No | ||
| 40 | UPP2 | 15009 13346 8032 | 3658 | 0.051 | 0.6301 | No | ||
| 41 | ENTPD6 | 4496 2678 | 3865 | 0.043 | 0.6197 | No | ||
| 42 | UPB1 | 19988 3389 | 4596 | 0.024 | 0.5807 | No | ||
| 43 | ITPA | 9193 | 5993 | 0.011 | 0.5056 | No | ||
| 44 | ENTPD3 | 19266 | 6168 | 0.010 | 0.4964 | No | ||
| 45 | ENTPD8 | 12996 | 6288 | 0.009 | 0.4901 | No | ||
| 46 | POLR3K | 12447 7372 | 6896 | 0.007 | 0.4575 | No | ||
| 47 | RRM2B | 6902 6903 11801 | 6930 | 0.007 | 0.4559 | No | ||
| 48 | POLE2 | 21053 | 7815 | 0.004 | 0.4082 | No | ||
| 49 | POLR2C | 9750 | 8110 | 0.003 | 0.3925 | No | ||
| 50 | ENTPD1 | 4495 | 8187 | 0.003 | 0.3884 | No | ||
| 51 | UPP1 | 20947 1385 | 8237 | 0.003 | 0.3858 | No | ||
| 52 | POLA1 | 24112 | 9653 | -0.000 | 0.3095 | No | ||
| 53 | NP | 22027 9597 5273 5274 | 9773 | -0.001 | 0.3031 | No | ||
| 54 | DPYD | 15437 | 10098 | -0.002 | 0.2856 | No | ||
| 55 | CANT1 | 13304 | 11171 | -0.004 | 0.2279 | No | ||
| 56 | POLR3B | 12875 | 11695 | -0.006 | 0.1998 | No | ||
| 57 | DPYS | 22305 | 11730 | -0.006 | 0.1981 | No | ||
| 58 | CDA | 15702 | 11868 | -0.007 | 0.1908 | No | ||
| 59 | POLR2B | 16817 | 12059 | -0.007 | 0.1806 | No | ||
| 60 | NME7 | 926 4101 14070 3986 3946 931 | 13857 | -0.020 | 0.0840 | No | ||
| 61 | NT5C1B | 21315 | 14053 | -0.022 | 0.0739 | No | ||
| 62 | POLR2G | 23753 | 16110 | -0.165 | -0.0343 | No | ||
| 63 | NT5C3 | 17136 | 16113 | -0.167 | -0.0317 | No | ||
| 64 | TYMS | 5810 5809 3606 3598 | 16248 | -0.195 | -0.0357 | No | ||
| 65 | NT5C | 20151 | 16435 | -0.236 | -0.0419 | No | ||
| 66 | POLD1 | 17847 | 16839 | -0.368 | -0.0577 | No | ||
| 67 | AICDA | 17295 1087 | 17207 | -0.510 | -0.0691 | No | ||
| 68 | POLE4 | 12441 | 17279 | -0.536 | -0.0642 | No | ||
| 69 | NT5C2 | 3768 8052 | 17383 | -0.587 | -0.0602 | No | ||
| 70 | ENTPD5 | 4497 | 17497 | -0.654 | -0.0556 | No | ||
| 71 | CTPS2 | 12060 2571 | 17502 | -0.658 | -0.0451 | No | ||
| 72 | ZNRD1 | 1491 22987 | 17560 | -0.693 | -0.0369 | No | ||
| 73 | UCK1 | 10254 5831 10253 | 17649 | -0.753 | -0.0293 | No | ||
| 74 | DCK | 16808 | 17984 | -1.054 | -0.0302 | No | ||
| 75 | POLD4 | 12822 | 18404 | -1.867 | -0.0223 | No | ||
| 76 | TK2 | 18779 | 18447 | -2.064 | 0.0091 | No |