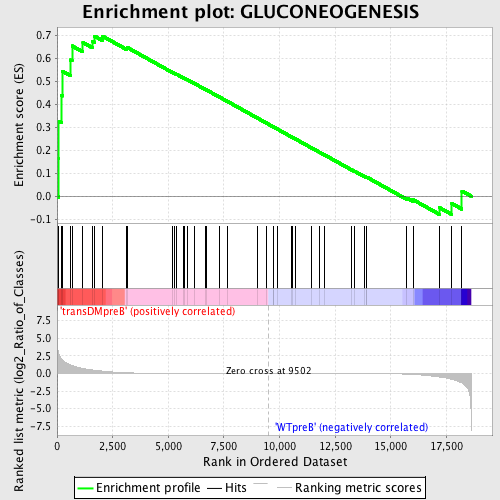
Profile of the Running ES Score & Positions of GeneSet Members on the Rank Ordered List
| Dataset | Set_04_transDMpreB_versus_WTpreB.phenotype_transDMpreB_versus_WTpreB.cls #transDMpreB_versus_WTpreB |
| Phenotype | phenotype_transDMpreB_versus_WTpreB.cls#transDMpreB_versus_WTpreB |
| Upregulated in class | transDMpreB |
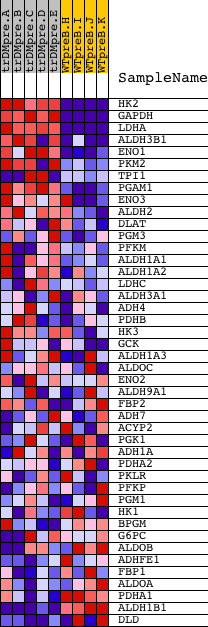
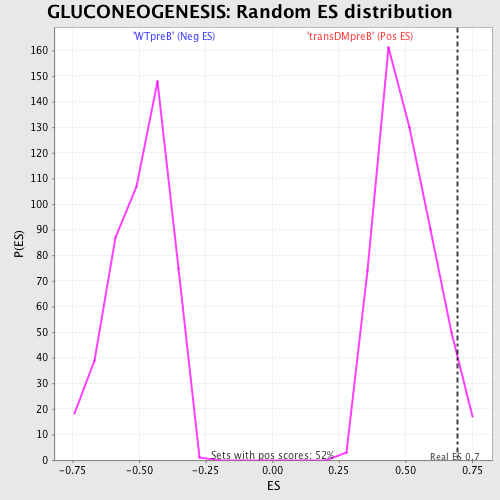
| GeneSet | GLUCONEOGENESIS |
| Enrichment Score (ES) | 0.6964453 |
| Normalized Enrichment Score (NES) | 1.3887345 |
| Nominal p-value | 0.043809526 |
| FDR q-value | 0.48224166 |
| FWER p-Value | 1.0 |
| PROBE | DESCRIPTION (from dataset) | GENE SYMBOL | GENE_TITLE | RANK IN GENE LIST | RANK METRIC SCORE | RUNNING ES | CORE ENRICHMENT | |
|---|---|---|---|---|---|---|---|---|
| 1 | HK2 | 17106 | 74 | 2.880 | 0.1643 | Yes | ||
| 2 | GAPDH | 348 348 9002 | 83 | 2.748 | 0.3244 | Yes | ||
| 3 | LDHA | 9269 | 190 | 2.057 | 0.4389 | Yes | ||
| 4 | ALDH3B1 | 12569 23949 | 247 | 1.838 | 0.5433 | Yes | ||
| 5 | ENO1 | 8903 | 611 | 1.181 | 0.5927 | Yes | ||
| 6 | PKM2 | 3642 9573 | 675 | 1.102 | 0.6538 | Yes | ||
| 7 | TPI1 | 5795 10212 | 1160 | 0.698 | 0.6685 | Yes | ||
| 8 | PGAM1 | 9556 | 1578 | 0.500 | 0.6752 | Yes | ||
| 9 | ENO3 | 8905 | 1683 | 0.459 | 0.6964 | Yes | ||
| 10 | ALDH2 | 16384 | 2040 | 0.328 | 0.6964 | Yes | ||
| 11 | DLAT | 19123 | 3116 | 0.092 | 0.6439 | No | ||
| 12 | PGM3 | 19045 | 3153 | 0.088 | 0.6471 | No | ||
| 13 | PFKM | 5243 9554 | 5164 | 0.017 | 0.5399 | No | ||
| 14 | ALDH1A1 | 8569 | 5282 | 0.016 | 0.5345 | No | ||
| 15 | ALDH1A2 | 19386 | 5372 | 0.015 | 0.5306 | No | ||
| 16 | LDHC | 18235 2235 | 5685 | 0.013 | 0.5145 | No | ||
| 17 | ALDH3A1 | 20854 | 5707 | 0.012 | 0.5141 | No | ||
| 18 | ADH4 | 15405 | 5840 | 0.012 | 0.5077 | No | ||
| 19 | PDHB | 12670 7548 | 6158 | 0.010 | 0.4912 | No | ||
| 20 | HK3 | 3224 477 | 6649 | 0.008 | 0.4653 | No | ||
| 21 | GCK | 20535 | 6732 | 0.008 | 0.4613 | No | ||
| 22 | ALDH1A3 | 17802 | 7278 | 0.006 | 0.4323 | No | ||
| 23 | ALDOC | 20759 311 | 7658 | 0.005 | 0.4122 | No | ||
| 24 | ENO2 | 8904 | 8991 | 0.001 | 0.3406 | No | ||
| 25 | ALDH9A1 | 14064 | 9402 | 0.000 | 0.3185 | No | ||
| 26 | FBP2 | 21422 | 9716 | -0.001 | 0.3017 | No | ||
| 27 | ADH7 | 15408 | 9731 | -0.001 | 0.3010 | No | ||
| 28 | ACYP2 | 20508 | 9920 | -0.001 | 0.2909 | No | ||
| 29 | PGK1 | 9557 5244 | 10544 | -0.003 | 0.2575 | No | ||
| 30 | ADH1A | 15406 | 10601 | -0.003 | 0.2547 | No | ||
| 31 | PDHA2 | 15153 | 10692 | -0.003 | 0.2500 | No | ||
| 32 | PKLR | 1850 15545 | 11427 | -0.005 | 0.2108 | No | ||
| 33 | PFKP | 3267 3168 7118 | 11796 | -0.006 | 0.1913 | No | ||
| 34 | PGM1 | 16841 | 12021 | -0.007 | 0.1797 | No | ||
| 35 | HK1 | 4854 | 13249 | -0.014 | 0.1144 | No | ||
| 36 | BPGM | 17489 | 13387 | -0.015 | 0.1079 | No | ||
| 37 | G6PC | 20656 | 13811 | -0.019 | 0.0862 | No | ||
| 38 | ALDOB | 10494 | 13910 | -0.021 | 0.0822 | No | ||
| 39 | ADHFE1 | 4049 8008 | 13927 | -0.021 | 0.0825 | No | ||
| 40 | FBP1 | 21423 | 15719 | -0.097 | -0.0083 | No | ||
| 41 | ALDOA | 8572 | 15996 | -0.139 | -0.0150 | No | ||
| 42 | PDHA1 | 24020 | 17188 | -0.502 | -0.0498 | No | ||
| 43 | ALDH1B1 | 16219 | 17740 | -0.818 | -0.0317 | No | ||
| 44 | DLD | 2097 21090 | 18196 | -1.348 | 0.0226 | No |