Profile of the Running ES Score & Positions of GeneSet Members on the Rank Ordered List
| Dataset | Set_04_transDMpreB_versus_WTpreB.phenotype_transDMpreB_versus_WTpreB.cls #transDMpreB_versus_WTpreB |
| Phenotype | phenotype_transDMpreB_versus_WTpreB.cls#transDMpreB_versus_WTpreB |
| Upregulated in class | WTpreB |
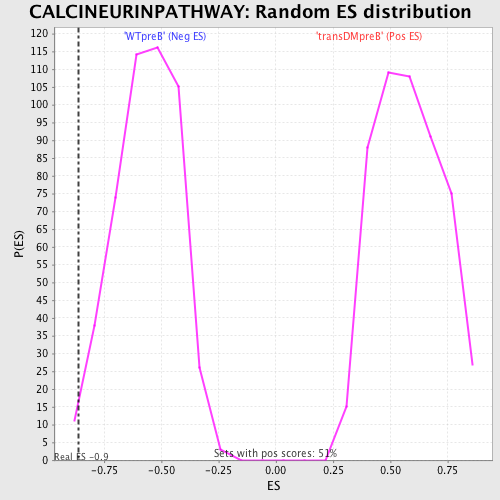
| GeneSet | CALCINEURINPATHWAY |
| Enrichment Score (ES) | -0.8637026 |
| Normalized Enrichment Score (NES) | -1.5371654 |
| Nominal p-value | 0.01026694 |
| FDR q-value | 0.19074579 |
| FWER p-Value | 0.718 |
| PROBE | DESCRIPTION (from dataset) | GENE SYMBOL | GENE_TITLE | RANK IN GENE LIST | RANK METRIC SCORE | RUNNING ES | CORE ENRICHMENT | |
|---|---|---|---|---|---|---|---|---|
| 1 | GNAQ | 4786 23909 3685 | 3787 | 0.045 | -0.1996 | No | ||
| 2 | CALM1 | 21184 | 6895 | 0.007 | -0.3660 | No | ||
| 3 | PPP3CA | 1863 5284 | 9030 | 0.001 | -0.4806 | No | ||
| 4 | SYT1 | 5565 | 9505 | -0.000 | -0.5061 | No | ||
| 5 | PLCG1 | 14753 | 9774 | -0.001 | -0.5205 | No | ||
| 6 | NFATC2 | 5168 2866 | 10619 | -0.003 | -0.5656 | No | ||
| 7 | SP3 | 5483 | 11020 | -0.004 | -0.5868 | No | ||
| 8 | NFATC4 | 22002 | 11663 | -0.006 | -0.6208 | No | ||
| 9 | SP1 | 9852 | 15014 | -0.048 | -0.7966 | No | ||
| 10 | CALM2 | 8681 | 16194 | -0.184 | -0.8437 | Yes | ||
| 11 | NFATC3 | 5169 | 16282 | -0.202 | -0.8303 | Yes | ||
| 12 | CALM3 | 8682 | 16904 | -0.395 | -0.8285 | Yes | ||
| 13 | PPP3CB | 5285 | 16962 | -0.419 | -0.7943 | Yes | ||
| 14 | PRKCB1 | 1693 9574 | 17109 | -0.475 | -0.7598 | Yes | ||
| 15 | PPP3CC | 21763 | 17176 | -0.498 | -0.7189 | Yes | ||
| 16 | PRKCA | 20174 | 17237 | -0.520 | -0.6758 | Yes | ||
| 17 | CDKN1A | 4511 8729 | 18439 | -2.021 | -0.5603 | Yes | ||
| 18 | NFATC1 | 23398 1999 5167 9455 1985 1957 | 18536 | -2.749 | -0.3204 | Yes | ||
| 19 | MARCKS | 9331 | 18574 | -3.642 | 0.0023 | Yes |