Profile of the Running ES Score & Positions of GeneSet Members on the Rank Ordered List
| Dataset | Set_04_transDMpreB_versus_WTpreB.phenotype_transDMpreB_versus_WTpreB.cls #transDMpreB_versus_WTpreB |
| Phenotype | phenotype_transDMpreB_versus_WTpreB.cls#transDMpreB_versus_WTpreB |
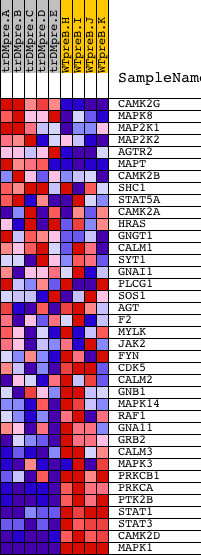
| Upregulated in class | WTpreB |
| GeneSet | BIOPEPTIDESPATHWAY |
| Enrichment Score (ES) | -0.7542853 |
| Normalized Enrichment Score (NES) | -1.4918224 |
| Nominal p-value | 0.023605151 |
| FDR q-value | 0.29007986 |
| FWER p-Value | 0.946 |
| PROBE | DESCRIPTION (from dataset) | GENE SYMBOL | GENE_TITLE | RANK IN GENE LIST | RANK METRIC SCORE | RUNNING ES | CORE ENRICHMENT | |
|---|---|---|---|---|---|---|---|---|
| 1 | CAMK2G | 21905 | 1141 | 0.708 | -0.0134 | No | ||
| 2 | MAPK8 | 6459 | 2251 | 0.267 | -0.0550 | No | ||
| 3 | MAP2K1 | 19082 | 2640 | 0.166 | -0.0646 | No | ||
| 4 | MAP2K2 | 19933 | 3325 | 0.072 | -0.0965 | No | ||
| 5 | AGTR2 | 24365 | 3340 | 0.071 | -0.0924 | No | ||
| 6 | MAPT | 9420 1347 | 3342 | 0.071 | -0.0877 | No | ||
| 7 | CAMK2B | 20536 | 4149 | 0.033 | -0.1288 | No | ||
| 8 | SHC1 | 9813 9812 5430 | 4437 | 0.027 | -0.1424 | No | ||
| 9 | STAT5A | 20664 | 4526 | 0.025 | -0.1454 | No | ||
| 10 | CAMK2A | 2024 23541 1980 | 4715 | 0.022 | -0.1540 | No | ||
| 11 | HRAS | 4868 | 4722 | 0.022 | -0.1529 | No | ||
| 12 | GNGT1 | 17533 | 6382 | 0.009 | -0.2415 | No | ||
| 13 | CALM1 | 21184 | 6895 | 0.007 | -0.2686 | No | ||
| 14 | SYT1 | 5565 | 9505 | -0.000 | -0.4090 | No | ||
| 15 | GNAI1 | 9024 | 9570 | -0.000 | -0.4125 | No | ||
| 16 | PLCG1 | 14753 | 9774 | -0.001 | -0.4234 | No | ||
| 17 | SOS1 | 5476 | 10751 | -0.003 | -0.4757 | No | ||
| 18 | AGT | 18711 | 12078 | -0.007 | -0.5466 | No | ||
| 19 | F2 | 14524 | 12380 | -0.009 | -0.5622 | No | ||
| 20 | MYLK | 22778 4213 | 14009 | -0.022 | -0.6483 | No | ||
| 21 | JAK2 | 23893 9197 3706 | 14328 | -0.027 | -0.6636 | No | ||
| 22 | FYN | 3375 3395 20052 | 15046 | -0.049 | -0.6988 | No | ||
| 23 | CDK5 | 16591 | 16077 | -0.157 | -0.7436 | Yes | ||
| 24 | CALM2 | 8681 | 16194 | -0.184 | -0.7374 | Yes | ||
| 25 | GNB1 | 15967 | 16221 | -0.189 | -0.7260 | Yes | ||
| 26 | MAPK14 | 23313 | 16271 | -0.200 | -0.7151 | Yes | ||
| 27 | RAF1 | 17035 | 16474 | -0.248 | -0.7092 | Yes | ||
| 28 | GNA11 | 3300 3345 19670 | 16880 | -0.387 | -0.7047 | Yes | ||
| 29 | GRB2 | 20149 | 16888 | -0.389 | -0.6787 | Yes | ||
| 30 | CALM3 | 8682 | 16904 | -0.395 | -0.6527 | Yes | ||
| 31 | MAPK3 | 6458 11170 | 17011 | -0.437 | -0.6288 | Yes | ||
| 32 | PRKCB1 | 1693 9574 | 17109 | -0.475 | -0.6018 | Yes | ||
| 33 | PRKCA | 20174 | 17237 | -0.520 | -0.5734 | Yes | ||
| 34 | PTK2B | 21776 | 18085 | -1.193 | -0.5381 | Yes | ||
| 35 | STAT1 | 3936 5524 | 18185 | -1.330 | -0.4532 | Yes | ||
| 36 | STAT3 | 5525 9906 | 18210 | -1.378 | -0.3610 | Yes | ||
| 37 | CAMK2D | 4232 | 18399 | -1.851 | -0.2456 | Yes | ||
| 38 | MAPK1 | 1642 11167 | 18579 | -3.793 | 0.0020 | Yes |