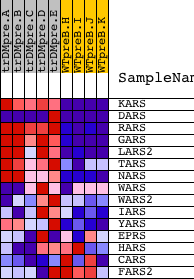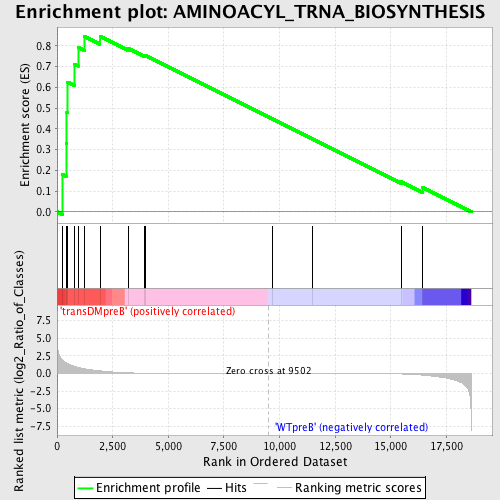
Profile of the Running ES Score & Positions of GeneSet Members on the Rank Ordered List
| Dataset | Set_04_transDMpreB_versus_WTpreB.phenotype_transDMpreB_versus_WTpreB.cls #transDMpreB_versus_WTpreB |
| Phenotype | phenotype_transDMpreB_versus_WTpreB.cls#transDMpreB_versus_WTpreB |
| Upregulated in class | transDMpreB |
| GeneSet | AMINOACYL_TRNA_BIOSYNTHESIS |
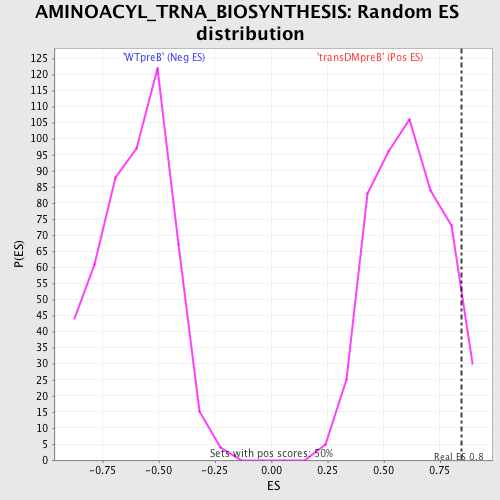
| Enrichment Score (ES) | 0.84743994 |
| Normalized Enrichment Score (NES) | 1.3944762 |
| Nominal p-value | 0.059760958 |
| FDR q-value | 0.53409207 |
| FWER p-Value | 1.0 |
| PROBE | DESCRIPTION (from dataset) | GENE SYMBOL | GENE_TITLE | RANK IN GENE LIST | RANK METRIC SCORE | RUNNING ES | CORE ENRICHMENT | |
|---|---|---|---|---|---|---|---|---|
| 1 | KARS | 18738 | 243 | 1.851 | 0.1808 | Yes | ||
| 2 | DARS | 10375 13846 | 403 | 1.505 | 0.3298 | Yes | ||
| 3 | RARS | 20496 | 439 | 1.460 | 0.4808 | Yes | ||
| 4 | GARS | 17438 | 476 | 1.393 | 0.6247 | Yes | ||
| 5 | LARS2 | 19255 | 792 | 0.988 | 0.7112 | Yes | ||
| 6 | TARS | 22325 8502 | 944 | 0.856 | 0.7927 | Yes | ||
| 7 | NARS | 23418 | 1225 | 0.659 | 0.8467 | Yes | ||
| 8 | WARS | 2085 20984 | 1927 | 0.367 | 0.8474 | Yes | ||
| 9 | WARS2 | 12884 7688 | 3218 | 0.081 | 0.7865 | No | ||
| 10 | IARS | 4190 8361 8362 | 3924 | 0.040 | 0.7529 | No | ||
| 11 | YARS | 16071 | 3986 | 0.038 | 0.7536 | No | ||
| 12 | EPRS | 14014 | 9702 | -0.001 | 0.4465 | No | ||
| 13 | HARS | 23451 | 11461 | -0.005 | 0.3525 | No | ||
| 14 | CARS | 1683 17544 | 15459 | -0.074 | 0.1454 | No | ||
| 15 | FARS2 | 21666 | 16410 | -0.232 | 0.1186 | No |