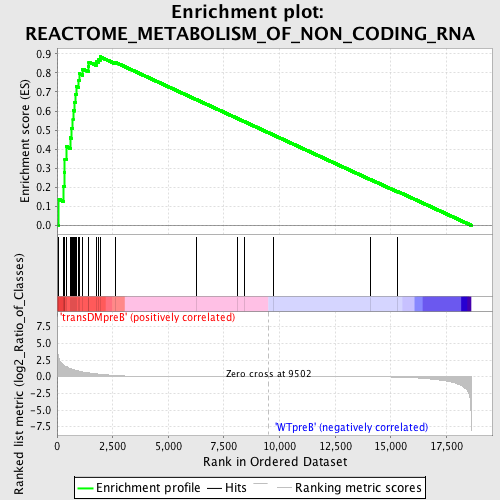
Profile of the Running ES Score & Positions of GeneSet Members on the Rank Ordered List
| Dataset | Set_04_transDMpreB_versus_WTpreB.phenotype_transDMpreB_versus_WTpreB.cls #transDMpreB_versus_WTpreB |
| Phenotype | phenotype_transDMpreB_versus_WTpreB.cls#transDMpreB_versus_WTpreB |
| Upregulated in class | transDMpreB |
| GeneSet | REACTOME_METABOLISM_OF_NON_CODING_RNA |
| Enrichment Score (ES) | 0.8844195 |
| Normalized Enrichment Score (NES) | 1.6152426 |
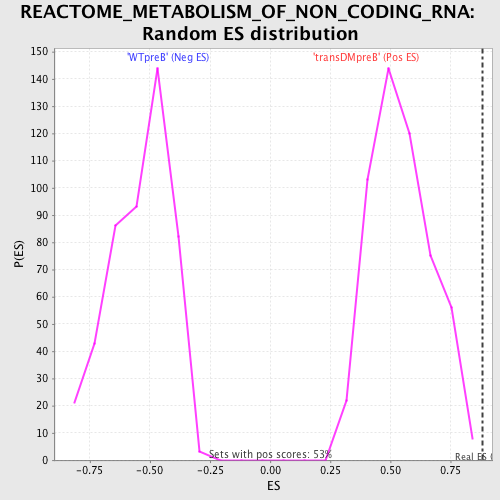
| Nominal p-value | 0.0 |
| FDR q-value | 0.03616286 |
| FWER p-Value | 0.21 |
| PROBE | DESCRIPTION (from dataset) | GENE SYMBOL | GENE_TITLE | RANK IN GENE LIST | RANK METRIC SCORE | RUNNING ES | CORE ENRICHMENT | |
|---|---|---|---|---|---|---|---|---|
| 1 | GEMIN4 | 6592 6591 | 56 | 3.063 | 0.1379 | Yes | ||
| 2 | PRMT5 | 6571 2817 | 277 | 1.725 | 0.2055 | Yes | ||
| 3 | NUP37 | 3294 3326 19909 | 326 | 1.608 | 0.2769 | Yes | ||
| 4 | NUP43 | 20094 | 349 | 1.577 | 0.3483 | Yes | ||
| 5 | SNRPD3 | 12514 | 419 | 1.494 | 0.4133 | Yes | ||
| 6 | NUP93 | 7762 | 594 | 1.201 | 0.4592 | Yes | ||
| 7 | NUPL2 | 6072 | 633 | 1.160 | 0.5105 | Yes | ||
| 8 | SNRPF | 7645 | 713 | 1.072 | 0.5556 | Yes | ||
| 9 | NCBP2 | 12643 | 720 | 1.059 | 0.6040 | Yes | ||
| 10 | RAE1 | 12395 | 793 | 0.987 | 0.6456 | Yes | ||
| 11 | NUP155 | 2298 5027 | 821 | 0.961 | 0.6884 | Yes | ||
| 12 | NUP107 | 8337 | 872 | 0.916 | 0.7278 | Yes | ||
| 13 | SNRPD2 | 8412 | 976 | 0.825 | 0.7603 | Yes | ||
| 14 | CLNS1A | 4526 4525 | 1005 | 0.802 | 0.7957 | Yes | ||
| 15 | SNRPG | 12622 | 1146 | 0.705 | 0.8206 | Yes | ||
| 16 | SIP1 | 21263 | 1409 | 0.565 | 0.8325 | Yes | ||
| 17 | NUP62 | 9497 | 1427 | 0.558 | 0.8573 | Yes | ||
| 18 | RANBP2 | 20019 | 1763 | 0.431 | 0.8591 | Yes | ||
| 19 | SNRPB | 9842 5469 2736 | 1874 | 0.384 | 0.8708 | Yes | ||
| 20 | NUP160 | 14957 | 1935 | 0.365 | 0.8844 | Yes | ||
| 21 | SNUPN | 12282 | 2616 | 0.171 | 0.8557 | No | ||
| 22 | TPR | 927 4255 | 6249 | 0.010 | 0.6608 | No | ||
| 23 | SNRPE | 9843 | 8094 | 0.004 | 0.5617 | No | ||
| 24 | NUP35 | 12803 | 8428 | 0.003 | 0.5439 | No | ||
| 25 | NUP153 | 21474 | 9747 | -0.001 | 0.4731 | No | ||
| 26 | NUP188 | 15053 | 14080 | -0.023 | 0.2411 | No | ||
| 27 | NUP54 | 11231 11232 6516 | 15306 | -0.062 | 0.1781 | No |