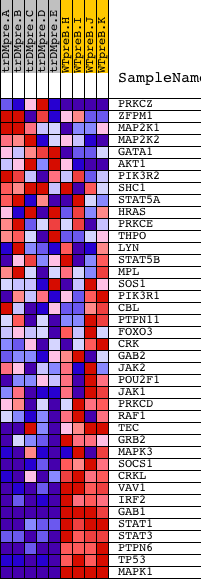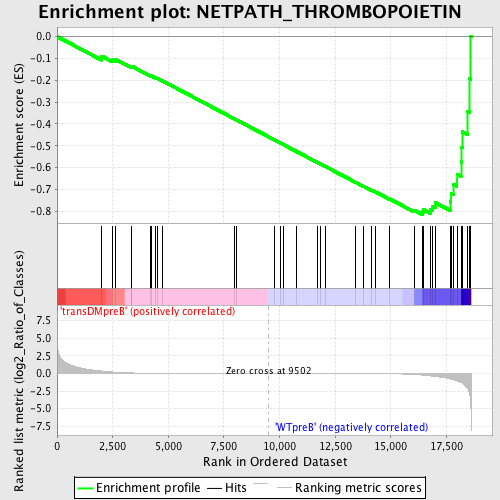
Profile of the Running ES Score & Positions of GeneSet Members on the Rank Ordered List
| Dataset | Set_04_transDMpreB_versus_WTpreB.phenotype_transDMpreB_versus_WTpreB.cls #transDMpreB_versus_WTpreB |
| Phenotype | phenotype_transDMpreB_versus_WTpreB.cls#transDMpreB_versus_WTpreB |
| Upregulated in class | WTpreB |
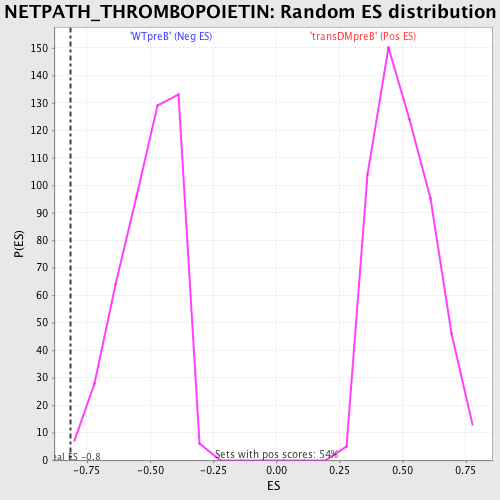
| GeneSet | NETPATH_THROMBOPOIETIN |
| Enrichment Score (ES) | -0.81464857 |
| Normalized Enrichment Score (NES) | -1.6180066 |
| Nominal p-value | 0.0021598272 |
| FDR q-value | 0.08219779 |
| FWER p-Value | 0.311 |
| PROBE | DESCRIPTION (from dataset) | GENE SYMBOL | GENE_TITLE | RANK IN GENE LIST | RANK METRIC SCORE | RUNNING ES | CORE ENRICHMENT | |
|---|---|---|---|---|---|---|---|---|
| 1 | PRKCZ | 5260 | 1997 | 0.346 | -0.0895 | No | ||
| 2 | ZFPM1 | 18439 | 2490 | 0.199 | -0.1057 | No | ||
| 3 | MAP2K1 | 19082 | 2640 | 0.166 | -0.1051 | No | ||
| 4 | MAP2K2 | 19933 | 3325 | 0.072 | -0.1381 | No | ||
| 5 | GATA1 | 24196 | 3343 | 0.071 | -0.1354 | No | ||
| 6 | AKT1 | 8568 | 4202 | 0.032 | -0.1799 | No | ||
| 7 | PIK3R2 | 18850 | 4225 | 0.031 | -0.1794 | No | ||
| 8 | SHC1 | 9813 9812 5430 | 4437 | 0.027 | -0.1894 | No | ||
| 9 | STAT5A | 20664 | 4526 | 0.025 | -0.1928 | No | ||
| 10 | HRAS | 4868 | 4722 | 0.022 | -0.2022 | No | ||
| 11 | PRKCE | 9575 | 7970 | 0.004 | -0.3767 | No | ||
| 12 | THPO | 22636 | 8052 | 0.004 | -0.3809 | No | ||
| 13 | LYN | 16281 | 9749 | -0.001 | -0.4722 | No | ||
| 14 | STAT5B | 20222 | 10036 | -0.001 | -0.4875 | No | ||
| 15 | MPL | 15780 | 10175 | -0.002 | -0.4948 | No | ||
| 16 | SOS1 | 5476 | 10751 | -0.003 | -0.5256 | No | ||
| 17 | PIK3R1 | 3170 | 11690 | -0.006 | -0.5758 | No | ||
| 18 | CBL | 19154 | 11840 | -0.006 | -0.5835 | No | ||
| 19 | PTPN11 | 5326 16391 9660 | 12084 | -0.007 | -0.5962 | No | ||
| 20 | FOXO3 | 19782 3402 | 13423 | -0.015 | -0.6674 | No | ||
| 21 | CRK | 4559 1249 | 13772 | -0.019 | -0.6852 | No | ||
| 22 | GAB2 | 1821 18184 2025 | 14144 | -0.024 | -0.7039 | No | ||
| 23 | JAK2 | 23893 9197 3706 | 14328 | -0.027 | -0.7124 | No | ||
| 24 | POU2F1 | 5275 3989 4065 4010 | 14921 | -0.044 | -0.7420 | No | ||
| 25 | JAK1 | 15827 | 16050 | -0.148 | -0.7950 | No | ||
| 26 | PRKCD | 21897 | 16416 | -0.233 | -0.8025 | Yes | ||
| 27 | RAF1 | 17035 | 16474 | -0.248 | -0.7927 | Yes | ||
| 28 | TEC | 16514 | 16770 | -0.340 | -0.7909 | Yes | ||
| 29 | GRB2 | 20149 | 16888 | -0.389 | -0.7770 | Yes | ||
| 30 | MAPK3 | 6458 11170 | 17011 | -0.437 | -0.7609 | Yes | ||
| 31 | SOCS1 | 4522 | 17684 | -0.779 | -0.7566 | Yes | ||
| 32 | CRKL | 4560 | 17704 | -0.794 | -0.7164 | Yes | ||
| 33 | VAV1 | 23173 | 17823 | -0.886 | -0.6767 | Yes | ||
| 34 | IRF2 | 18621 | 17974 | -1.043 | -0.6306 | Yes | ||
| 35 | GAB1 | 18828 | 18157 | -1.275 | -0.5741 | Yes | ||
| 36 | STAT1 | 3936 5524 | 18185 | -1.330 | -0.5064 | Yes | ||
| 37 | STAT3 | 5525 9906 | 18210 | -1.378 | -0.4361 | Yes | ||
| 38 | PTPN6 | 17002 | 18450 | -2.074 | -0.3411 | Yes | ||
| 39 | TP53 | 20822 | 18549 | -2.941 | -0.1936 | Yes | ||
| 40 | MAPK1 | 1642 11167 | 18579 | -3.793 | 0.0020 | Yes |