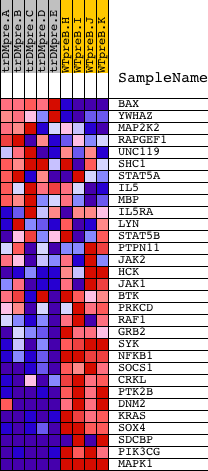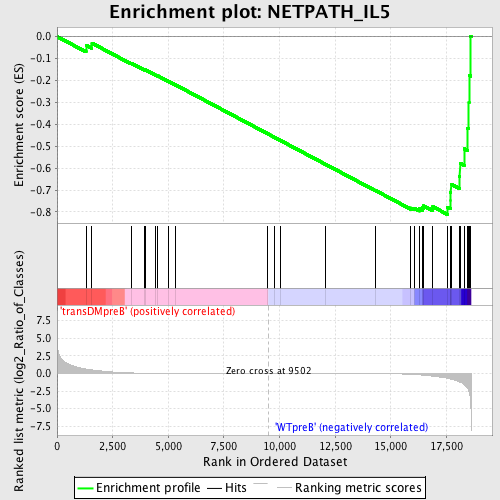
Profile of the Running ES Score & Positions of GeneSet Members on the Rank Ordered List
| Dataset | Set_04_transDMpreB_versus_WTpreB.phenotype_transDMpreB_versus_WTpreB.cls #transDMpreB_versus_WTpreB |
| Phenotype | phenotype_transDMpreB_versus_WTpreB.cls#transDMpreB_versus_WTpreB |
| Upregulated in class | WTpreB |
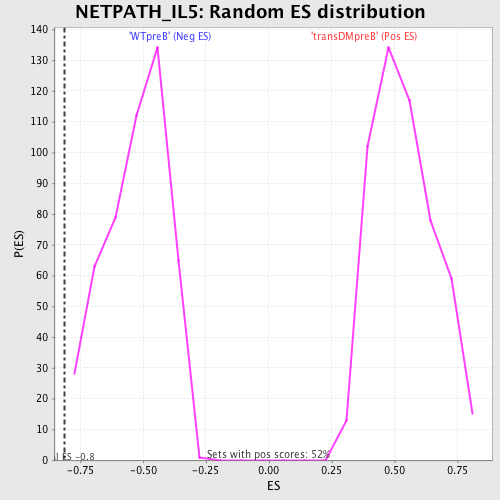
| GeneSet | NETPATH_IL5 |
| Enrichment Score (ES) | -0.8113695 |
| Normalized Enrichment Score (NES) | -1.5361626 |
| Nominal p-value | 0.002074689 |
| FDR q-value | 0.13291392 |
| FWER p-Value | 0.887 |
| PROBE | DESCRIPTION (from dataset) | GENE SYMBOL | GENE_TITLE | RANK IN GENE LIST | RANK METRIC SCORE | RUNNING ES | CORE ENRICHMENT | |
|---|---|---|---|---|---|---|---|---|
| 1 | BAX | 17832 | 1302 | 0.620 | -0.0402 | No | ||
| 2 | YWHAZ | 10370 | 1567 | 0.504 | -0.0302 | No | ||
| 3 | MAP2K2 | 19933 | 3325 | 0.072 | -0.1212 | No | ||
| 4 | RAPGEF1 | 4218 2860 | 3945 | 0.040 | -0.1526 | No | ||
| 5 | UNC119 | 20758 | 3954 | 0.039 | -0.1512 | No | ||
| 6 | SHC1 | 9813 9812 5430 | 4437 | 0.027 | -0.1758 | No | ||
| 7 | STAT5A | 20664 | 4526 | 0.025 | -0.1793 | No | ||
| 8 | IL5 | 20884 10220 | 5018 | 0.019 | -0.2048 | No | ||
| 9 | MBP | 23502 | 5332 | 0.015 | -0.2209 | No | ||
| 10 | IL5RA | 17051 | 9451 | 0.000 | -0.4425 | No | ||
| 11 | LYN | 16281 | 9749 | -0.001 | -0.4584 | No | ||
| 12 | STAT5B | 20222 | 10036 | -0.001 | -0.4738 | No | ||
| 13 | PTPN11 | 5326 16391 9660 | 12084 | -0.007 | -0.5835 | No | ||
| 14 | JAK2 | 23893 9197 3706 | 14328 | -0.027 | -0.7029 | No | ||
| 15 | HCK | 14787 | 15902 | -0.120 | -0.7818 | No | ||
| 16 | JAK1 | 15827 | 16050 | -0.148 | -0.7826 | No | ||
| 17 | BTK | 24061 | 16291 | -0.204 | -0.7856 | Yes | ||
| 18 | PRKCD | 21897 | 16416 | -0.233 | -0.7811 | Yes | ||
| 19 | RAF1 | 17035 | 16474 | -0.248 | -0.7723 | Yes | ||
| 20 | GRB2 | 20149 | 16888 | -0.389 | -0.7758 | Yes | ||
| 21 | SYK | 21636 | 17551 | -0.690 | -0.7782 | Yes | ||
| 22 | NFKB1 | 15160 | 17682 | -0.778 | -0.7477 | Yes | ||
| 23 | SOCS1 | 4522 | 17684 | -0.779 | -0.7103 | Yes | ||
| 24 | CRKL | 4560 | 17704 | -0.794 | -0.6732 | Yes | ||
| 25 | PTK2B | 21776 | 18085 | -1.193 | -0.6362 | Yes | ||
| 26 | DNM2 | 4635 3103 | 18109 | -1.237 | -0.5779 | Yes | ||
| 27 | KRAS | 9247 | 18298 | -1.598 | -0.5112 | Yes | ||
| 28 | SOX4 | 5479 | 18455 | -2.118 | -0.4177 | Yes | ||
| 29 | SDCBP | 2339 6998 6999 | 18512 | -2.526 | -0.2992 | Yes | ||
| 30 | PIK3CG | 6635 | 18517 | -2.540 | -0.1772 | Yes | ||
| 31 | MAPK1 | 1642 11167 | 18579 | -3.793 | 0.0020 | Yes |