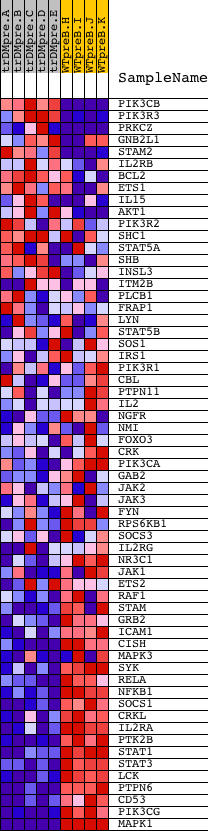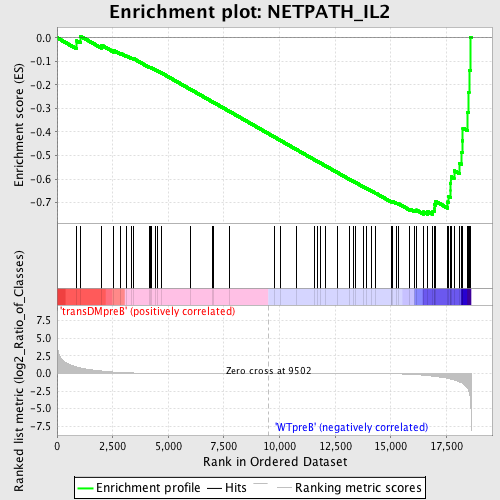
Profile of the Running ES Score & Positions of GeneSet Members on the Rank Ordered List
| Dataset | Set_04_transDMpreB_versus_WTpreB.phenotype_transDMpreB_versus_WTpreB.cls #transDMpreB_versus_WTpreB |
| Phenotype | phenotype_transDMpreB_versus_WTpreB.cls#transDMpreB_versus_WTpreB |
| Upregulated in class | WTpreB |
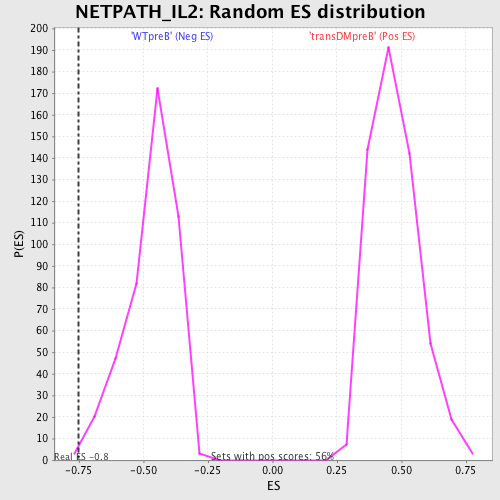
| GeneSet | NETPATH_IL2 |
| Enrichment Score (ES) | -0.75015074 |
| Normalized Enrichment Score (NES) | -1.6069154 |
| Nominal p-value | 0.0045454544 |
| FDR q-value | 0.07603753 |
| FWER p-Value | 0.388 |
| PROBE | DESCRIPTION (from dataset) | GENE SYMBOL | GENE_TITLE | RANK IN GENE LIST | RANK METRIC SCORE | RUNNING ES | CORE ENRICHMENT | |
|---|---|---|---|---|---|---|---|---|
| 1 | PIK3CB | 19030 | 882 | 0.909 | -0.0134 | No | ||
| 2 | PIK3R3 | 5248 | 1045 | 0.772 | 0.0069 | No | ||
| 3 | PRKCZ | 5260 | 1997 | 0.346 | -0.0313 | No | ||
| 4 | GNB2L1 | 20911 | 2547 | 0.186 | -0.0539 | No | ||
| 5 | STAM2 | 7095 2845 | 2852 | 0.128 | -0.0655 | No | ||
| 6 | IL2RB | 22219 | 3136 | 0.090 | -0.0774 | No | ||
| 7 | BCL2 | 8651 3928 13864 4435 981 4062 13863 4027 | 3347 | 0.070 | -0.0860 | No | ||
| 8 | ETS1 | 10715 6230 3135 | 3448 | 0.063 | -0.0891 | No | ||
| 9 | IL15 | 18826 3801 | 4158 | 0.033 | -0.1260 | No | ||
| 10 | AKT1 | 8568 | 4202 | 0.032 | -0.1271 | No | ||
| 11 | PIK3R2 | 18850 | 4225 | 0.031 | -0.1271 | No | ||
| 12 | SHC1 | 9813 9812 5430 | 4437 | 0.027 | -0.1375 | No | ||
| 13 | STAT5A | 20664 | 4526 | 0.025 | -0.1413 | No | ||
| 14 | SHB | 10493 | 4678 | 0.023 | -0.1486 | No | ||
| 15 | INSL3 | 9181 | 5985 | 0.011 | -0.2185 | No | ||
| 16 | ITM2B | 9192 4935 21753 | 7006 | 0.007 | -0.2733 | No | ||
| 17 | PLCB1 | 14832 2821 | 7050 | 0.007 | -0.2753 | No | ||
| 18 | FRAP1 | 2468 15991 | 7736 | 0.004 | -0.3121 | No | ||
| 19 | LYN | 16281 | 9749 | -0.001 | -0.4205 | No | ||
| 20 | STAT5B | 20222 | 10036 | -0.001 | -0.4358 | No | ||
| 21 | SOS1 | 5476 | 10751 | -0.003 | -0.4742 | No | ||
| 22 | IRS1 | 4925 | 11569 | -0.005 | -0.5180 | No | ||
| 23 | PIK3R1 | 3170 | 11690 | -0.006 | -0.5243 | No | ||
| 24 | CBL | 19154 | 11840 | -0.006 | -0.5321 | No | ||
| 25 | PTPN11 | 5326 16391 9660 | 12084 | -0.007 | -0.5449 | No | ||
| 26 | IL2 | 15354 | 12604 | -0.010 | -0.5725 | No | ||
| 27 | NGFR | 5174 | 13147 | -0.013 | -0.6012 | No | ||
| 28 | NMI | 14590 | 13326 | -0.014 | -0.6103 | No | ||
| 29 | FOXO3 | 19782 3402 | 13423 | -0.015 | -0.6149 | No | ||
| 30 | CRK | 4559 1249 | 13772 | -0.019 | -0.6329 | No | ||
| 31 | PIK3CA | 9562 | 13925 | -0.021 | -0.6403 | No | ||
| 32 | GAB2 | 1821 18184 2025 | 14144 | -0.024 | -0.6512 | No | ||
| 33 | JAK2 | 23893 9197 3706 | 14328 | -0.027 | -0.6600 | No | ||
| 34 | JAK3 | 9198 4936 | 15025 | -0.048 | -0.6957 | No | ||
| 35 | FYN | 3375 3395 20052 | 15046 | -0.049 | -0.6950 | No | ||
| 36 | RPS6KB1 | 7815 1207 13040 | 15086 | -0.051 | -0.6952 | No | ||
| 37 | SOCS3 | 20131 | 15249 | -0.059 | -0.7017 | No | ||
| 38 | IL2RG | 24096 | 15358 | -0.066 | -0.7050 | No | ||
| 39 | NR3C1 | 9043 | 15860 | -0.114 | -0.7277 | No | ||
| 40 | JAK1 | 15827 | 16050 | -0.148 | -0.7323 | No | ||
| 41 | ETS2 | 10716 | 16147 | -0.172 | -0.7310 | No | ||
| 42 | RAF1 | 17035 | 16474 | -0.248 | -0.7393 | Yes | ||
| 43 | STAM | 2912 15117 | 16658 | -0.302 | -0.7378 | Yes | ||
| 44 | GRB2 | 20149 | 16888 | -0.389 | -0.7355 | Yes | ||
| 45 | ICAM1 | 19545 | 16961 | -0.419 | -0.7237 | Yes | ||
| 46 | CISH | 8743 | 16967 | -0.421 | -0.7081 | Yes | ||
| 47 | MAPK3 | 6458 11170 | 17011 | -0.437 | -0.6940 | Yes | ||
| 48 | SYK | 21636 | 17551 | -0.690 | -0.6971 | Yes | ||
| 49 | RELA | 23783 | 17583 | -0.705 | -0.6723 | Yes | ||
| 50 | NFKB1 | 15160 | 17682 | -0.778 | -0.6483 | Yes | ||
| 51 | SOCS1 | 4522 | 17684 | -0.779 | -0.6191 | Yes | ||
| 52 | CRKL | 4560 | 17704 | -0.794 | -0.5903 | Yes | ||
| 53 | IL2RA | 4918 | 17844 | -0.900 | -0.5639 | Yes | ||
| 54 | PTK2B | 21776 | 18085 | -1.193 | -0.5320 | Yes | ||
| 55 | STAT1 | 3936 5524 | 18185 | -1.330 | -0.4873 | Yes | ||
| 56 | STAT3 | 5525 9906 | 18210 | -1.378 | -0.4368 | Yes | ||
| 57 | LCK | 15746 | 18240 | -1.451 | -0.3838 | Yes | ||
| 58 | PTPN6 | 17002 | 18450 | -2.074 | -0.3171 | Yes | ||
| 59 | CD53 | 4500 | 18486 | -2.334 | -0.2312 | Yes | ||
| 60 | PIK3CG | 6635 | 18517 | -2.540 | -0.1373 | Yes | ||
| 61 | MAPK1 | 1642 11167 | 18579 | -3.793 | 0.0020 | Yes |