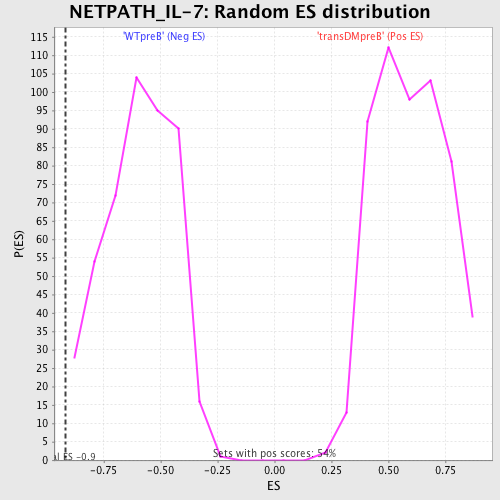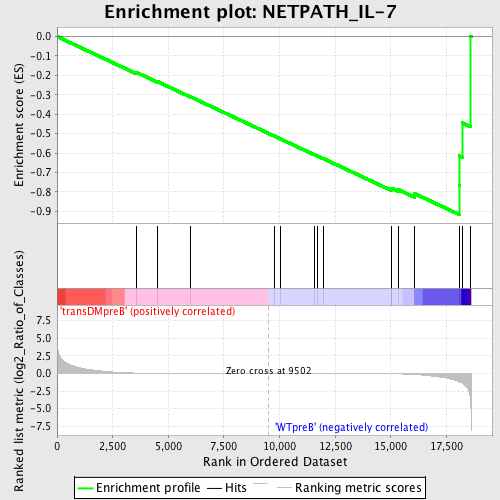
Profile of the Running ES Score & Positions of GeneSet Members on the Rank Ordered List
| Dataset | Set_04_transDMpreB_versus_WTpreB.phenotype_transDMpreB_versus_WTpreB.cls #transDMpreB_versus_WTpreB |
| Phenotype | phenotype_transDMpreB_versus_WTpreB.cls#transDMpreB_versus_WTpreB |
| Upregulated in class | WTpreB |
| GeneSet | NETPATH_IL-7 |
| Enrichment Score (ES) | -0.916758 |
| Normalized Enrichment Score (NES) | -1.544529 |
| Nominal p-value | 0.002173913 |
| FDR q-value | 0.12720357 |
| FWER p-Value | 0.846 |
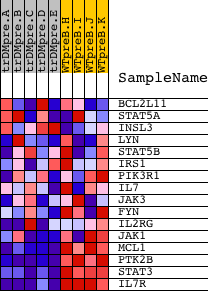
| PROBE | DESCRIPTION (from dataset) | GENE SYMBOL | GENE_TITLE | RANK IN GENE LIST | RANK METRIC SCORE | RUNNING ES | CORE ENRICHMENT | |
|---|---|---|---|---|---|---|---|---|
| 1 | BCL2L11 | 2790 14861 | 3579 | 0.055 | -0.1854 | No | ||
| 2 | STAT5A | 20664 | 4526 | 0.025 | -0.2330 | No | ||
| 3 | INSL3 | 9181 | 5985 | 0.011 | -0.3100 | No | ||
| 4 | LYN | 16281 | 9749 | -0.001 | -0.5122 | No | ||
| 5 | STAT5B | 20222 | 10036 | -0.001 | -0.5274 | No | ||
| 6 | IRS1 | 4925 | 11569 | -0.005 | -0.6091 | No | ||
| 7 | PIK3R1 | 3170 | 11690 | -0.006 | -0.6147 | No | ||
| 8 | IL7 | 4921 | 11981 | -0.007 | -0.6294 | No | ||
| 9 | JAK3 | 9198 4936 | 15025 | -0.048 | -0.7869 | No | ||
| 10 | FYN | 3375 3395 20052 | 15046 | -0.049 | -0.7816 | No | ||
| 11 | IL2RG | 24096 | 15358 | -0.066 | -0.7899 | No | ||
| 12 | JAK1 | 15827 | 16050 | -0.148 | -0.8081 | Yes | ||
| 13 | MCL1 | 15502 | 18072 | -1.174 | -0.7665 | Yes | ||
| 14 | PTK2B | 21776 | 18085 | -1.193 | -0.6145 | Yes | ||
| 15 | STAT3 | 5525 9906 | 18210 | -1.378 | -0.4448 | Yes | ||
| 16 | IL7R | 9175 4922 | 18575 | -3.646 | 0.0022 | Yes |