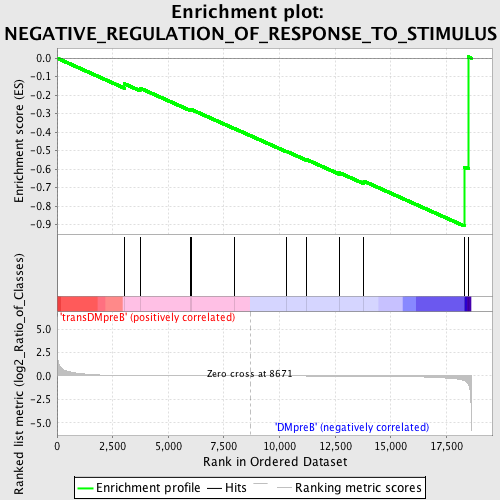
Profile of the Running ES Score & Positions of GeneSet Members on the Rank Ordered List
| Dataset | Set_04_transDMpreB_versus_DMpreB.phenotype_transDMpreB_versus_DMpreB.cls #transDMpreB_versus_DMpreB.phenotype_transDMpreB_versus_DMpreB.cls #transDMpreB_versus_DMpreB_repos |
| Phenotype | phenotype_transDMpreB_versus_DMpreB.cls#transDMpreB_versus_DMpreB_repos |
| Upregulated in class | DMpreB |
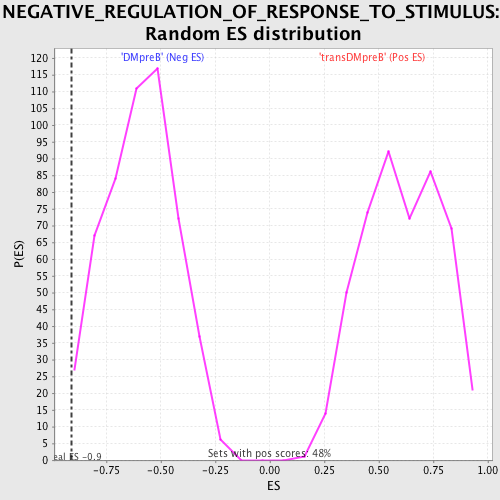
| GeneSet | NEGATIVE_REGULATION_OF_RESPONSE_TO_STIMULUS |
| Enrichment Score (ES) | -0.90794766 |
| Normalized Enrichment Score (NES) | -1.5322807 |
| Nominal p-value | 0.007677543 |
| FDR q-value | 0.5303757 |
| FWER p-Value | 1.0 |
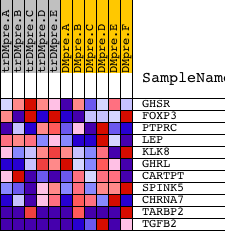
| PROBE | DESCRIPTION (from dataset) | GENE SYMBOL | GENE_TITLE | RANK IN GENE LIST | RANK METRIC SCORE | RUNNING ES | CORE ENRICHMENT | |
|---|---|---|---|---|---|---|---|---|
| 1 | GHSR | 1810 15625 | 3029 | 0.036 | -0.1390 | No | ||
| 2 | FOXP3 | 9804 5426 | 3729 | 0.021 | -0.1624 | No | ||
| 3 | PTPRC | 5327 9662 | 5983 | 0.006 | -0.2793 | No | ||
| 4 | LEP | 17505 | 6042 | 0.006 | -0.2783 | No | ||
| 5 | KLK8 | 18269 18271 | 7974 | 0.001 | -0.3811 | No | ||
| 6 | GHRL | 1183 17040 | 10313 | -0.004 | -0.5044 | No | ||
| 7 | CARTPT | 21374 | 11210 | -0.006 | -0.5486 | No | ||
| 8 | SPINK5 | 23569 | 12703 | -0.012 | -0.6209 | No | ||
| 9 | CHRNA7 | 17808 | 13792 | -0.020 | -0.6659 | Yes | ||
| 10 | TARBP2 | 10033 10034 5626 | 18297 | -0.481 | -0.5893 | Yes | ||
| 11 | TGFB2 | 5743 | 18487 | -0.915 | 0.0069 | Yes |