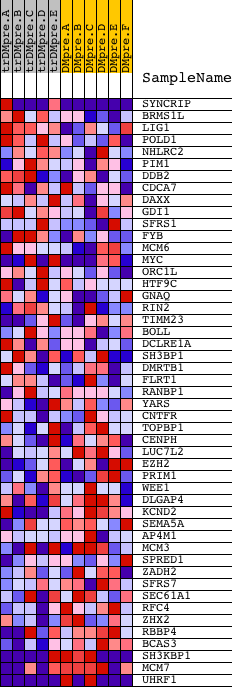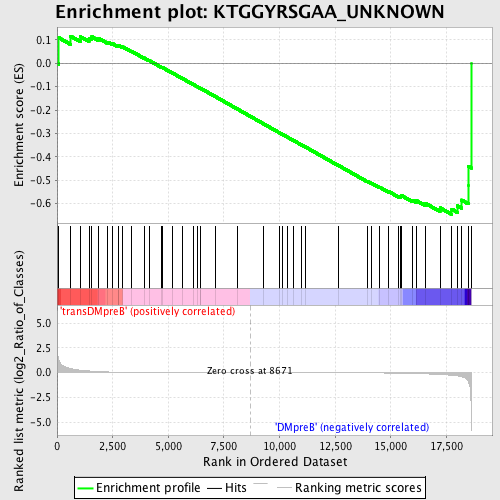
Profile of the Running ES Score & Positions of GeneSet Members on the Rank Ordered List
| Dataset | Set_04_transDMpreB_versus_DMpreB.phenotype_transDMpreB_versus_DMpreB.cls #transDMpreB_versus_DMpreB.phenotype_transDMpreB_versus_DMpreB.cls #transDMpreB_versus_DMpreB_repos |
| Phenotype | phenotype_transDMpreB_versus_DMpreB.cls#transDMpreB_versus_DMpreB_repos |
| Upregulated in class | DMpreB |
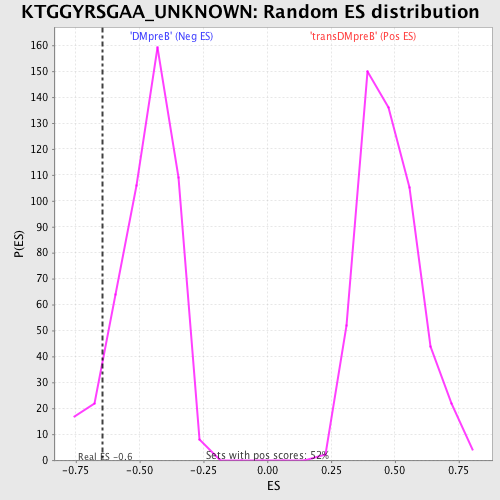
| GeneSet | KTGGYRSGAA_UNKNOWN |
| Enrichment Score (ES) | -0.6460143 |
| Normalized Enrichment Score (NES) | -1.3737664 |
| Nominal p-value | 0.072164945 |
| FDR q-value | 1.0 |
| FWER p-Value | 1.0 |
| PROBE | DESCRIPTION (from dataset) | GENE SYMBOL | GENE_TITLE | RANK IN GENE LIST | RANK METRIC SCORE | RUNNING ES | CORE ENRICHMENT | |
|---|---|---|---|---|---|---|---|---|
| 1 | SYNCRIP | 3078 3035 3107 | 80 | 1.313 | 0.1087 | No | ||
| 2 | BRMS1L | 21268 | 603 | 0.410 | 0.1158 | No | ||
| 3 | LIG1 | 18388 1749 1493 | 1053 | 0.248 | 0.1130 | No | ||
| 4 | POLD1 | 17847 | 1436 | 0.169 | 0.1070 | No | ||
| 5 | NHLRC2 | 23828 | 1562 | 0.150 | 0.1131 | No | ||
| 6 | PIM1 | 23308 | 1846 | 0.111 | 0.1075 | No | ||
| 7 | DDB2 | 2721 2878 14525 2661 | 2279 | 0.069 | 0.0901 | No | ||
| 8 | CDCA7 | 12437 | 2506 | 0.056 | 0.0828 | No | ||
| 9 | DAXX | 23290 | 2746 | 0.045 | 0.0738 | No | ||
| 10 | GDI1 | 9012 4770 24297 4769 | 2774 | 0.044 | 0.0761 | No | ||
| 11 | SFRS1 | 8492 | 2955 | 0.038 | 0.0697 | No | ||
| 12 | FYB | 10717 | 3333 | 0.028 | 0.0518 | No | ||
| 13 | MCM6 | 4000 13845 4119 | 3908 | 0.019 | 0.0226 | No | ||
| 14 | MYC | 22465 9435 | 4133 | 0.017 | 0.0119 | No | ||
| 15 | ORC1L | 327 16144 | 4683 | 0.012 | -0.0166 | No | ||
| 16 | HTF9C | 4886 1678 | 4745 | 0.012 | -0.0189 | No | ||
| 17 | GNAQ | 4786 23909 3685 | 5192 | 0.009 | -0.0421 | No | ||
| 18 | RIN2 | 14817 | 5635 | 0.008 | -0.0652 | No | ||
| 19 | TIMM23 | 7004 5768 | 6115 | 0.006 | -0.0905 | No | ||
| 20 | BOLL | 7960 | 6311 | 0.005 | -0.1006 | No | ||
| 21 | DCLRE1A | 23641 | 6437 | 0.005 | -0.1069 | No | ||
| 22 | SH3BP1 | 632 22431 | 6456 | 0.005 | -0.1074 | No | ||
| 23 | DMRTB1 | 15813 | 7116 | 0.003 | -0.1426 | No | ||
| 24 | FLRT1 | 11852 | 8115 | 0.001 | -0.1963 | No | ||
| 25 | RANBP1 | 9692 5357 | 9288 | -0.001 | -0.2593 | No | ||
| 26 | YARS | 16071 | 9979 | -0.003 | -0.2962 | No | ||
| 27 | CNTFR | 2515 15906 | 10145 | -0.003 | -0.3048 | No | ||
| 28 | TOPBP1 | 10659 | 10359 | -0.004 | -0.3159 | No | ||
| 29 | CENPH | 21363 | 10603 | -0.004 | -0.3286 | No | ||
| 30 | LUC7L2 | 5313 5312 | 10971 | -0.005 | -0.3479 | No | ||
| 31 | EZH2 | 1092 17163 | 11186 | -0.006 | -0.3590 | No | ||
| 32 | PRIM1 | 19847 | 12641 | -0.012 | -0.4363 | No | ||
| 33 | WEE1 | 18127 | 13959 | -0.022 | -0.5053 | No | ||
| 34 | DLGAP4 | 2950 10461 | 14132 | -0.024 | -0.5125 | No | ||
| 35 | KCND2 | 4941 17515 | 14504 | -0.030 | -0.5299 | No | ||
| 36 | SEMA5A | 22496 5423 | 14904 | -0.039 | -0.5480 | No | ||
| 37 | AP4M1 | 3499 16656 | 15358 | -0.051 | -0.5680 | No | ||
| 38 | MCM3 | 13991 | 15446 | -0.054 | -0.5681 | No | ||
| 39 | SPRED1 | 4331 | 15460 | -0.055 | -0.5641 | No | ||
| 40 | ZADH2 | 23501 | 15985 | -0.079 | -0.5855 | No | ||
| 41 | SFRS7 | 22889 | 16140 | -0.088 | -0.5862 | No | ||
| 42 | SEC61A1 | 60 | 16571 | -0.119 | -0.5991 | No | ||
| 43 | RFC4 | 1735 22627 | 17215 | -0.186 | -0.6177 | No | ||
| 44 | ZHX2 | 11842 | 17741 | -0.262 | -0.6235 | Yes | ||
| 45 | RBBP4 | 5364 | 17991 | -0.322 | -0.6092 | Yes | ||
| 46 | BCAS3 | 5314 | 18177 | -0.408 | -0.5841 | Yes | ||
| 47 | SH3KBP1 | 2631 12206 7189 | 18489 | -0.920 | -0.5217 | Yes | ||
| 48 | MCM7 | 9372 3568 | 18494 | -0.936 | -0.4414 | Yes | ||
| 49 | UHRF1 | 5185 9477 | 18614 | -5.207 | 0.0001 | Yes |