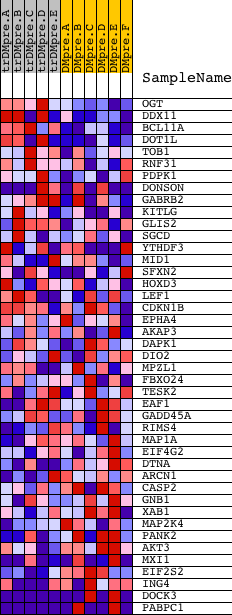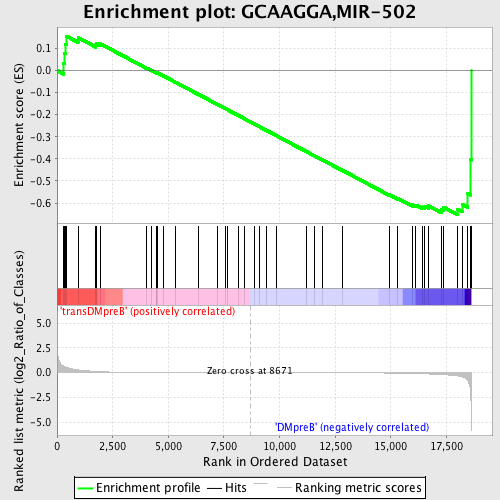
Profile of the Running ES Score & Positions of GeneSet Members on the Rank Ordered List
| Dataset | Set_04_transDMpreB_versus_DMpreB.phenotype_transDMpreB_versus_DMpreB.cls #transDMpreB_versus_DMpreB.phenotype_transDMpreB_versus_DMpreB.cls #transDMpreB_versus_DMpreB_repos |
| Phenotype | phenotype_transDMpreB_versus_DMpreB.cls#transDMpreB_versus_DMpreB_repos |
| Upregulated in class | DMpreB |
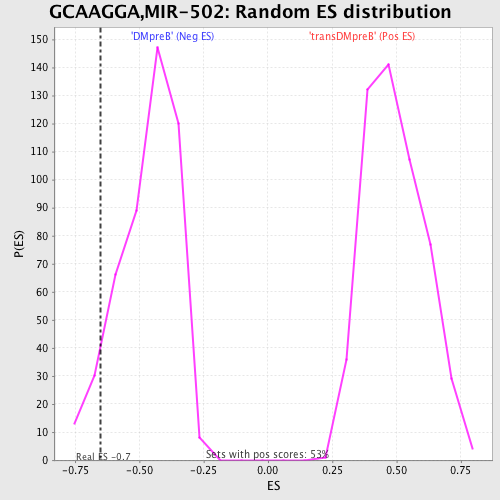
| GeneSet | GCAAGGA,MIR-502 |
| Enrichment Score (ES) | -0.65187395 |
| Normalized Enrichment Score (NES) | -1.3908751 |
| Nominal p-value | 0.0782241 |
| FDR q-value | 1.0 |
| FWER p-Value | 1.0 |
| PROBE | DESCRIPTION (from dataset) | GENE SYMBOL | GENE_TITLE | RANK IN GENE LIST | RANK METRIC SCORE | RUNNING ES | CORE ENRICHMENT | |
|---|---|---|---|---|---|---|---|---|
| 1 | OGT | 4241 24274 | 300 | 0.635 | 0.0327 | No | ||
| 2 | DDX11 | 23169 | 329 | 0.603 | 0.0775 | No | ||
| 3 | BCL11A | 4691 | 380 | 0.557 | 0.1177 | No | ||
| 4 | DOT1L | 19937 | 421 | 0.522 | 0.1557 | No | ||
| 5 | TOB1 | 20703 | 942 | 0.278 | 0.1491 | No | ||
| 6 | RNF31 | 11206 | 1743 | 0.124 | 0.1155 | No | ||
| 7 | PDPK1 | 23097 | 1785 | 0.119 | 0.1224 | No | ||
| 8 | DONSON | 1655 22540 | 1964 | 0.096 | 0.1202 | No | ||
| 9 | GABRB2 | 20922 | 4016 | 0.018 | 0.0112 | No | ||
| 10 | KITLG | 19889 3342 | 4230 | 0.016 | 0.0009 | No | ||
| 11 | GLIS2 | 8179 13500 | 4474 | 0.014 | -0.0111 | No | ||
| 12 | SGCD | 1425 10779 | 4478 | 0.014 | -0.0102 | No | ||
| 13 | YTHDF3 | 15630 10469 6019 | 4520 | 0.013 | -0.0114 | No | ||
| 14 | MID1 | 5097 5098 | 4796 | 0.011 | -0.0253 | No | ||
| 15 | SFXN2 | 3707 8255 3678 13588 | 5336 | 0.009 | -0.0537 | No | ||
| 16 | HOXD3 | 9115 | 6372 | 0.005 | -0.1090 | No | ||
| 17 | LEF1 | 1860 15420 | 7191 | 0.003 | -0.1528 | No | ||
| 18 | CDKN1B | 4512 8730 | 7584 | 0.002 | -0.1737 | No | ||
| 19 | EPHA4 | 4673 | 7640 | 0.002 | -0.1765 | No | ||
| 20 | AKAP3 | 8566 | 8152 | 0.001 | -0.2040 | No | ||
| 21 | DAPK1 | 7632 | 8443 | 0.000 | -0.2196 | No | ||
| 22 | DIO2 | 21014 2159 | 8884 | -0.000 | -0.2432 | No | ||
| 23 | MPZL1 | 13777 | 9076 | -0.001 | -0.2534 | No | ||
| 24 | FBXO24 | 12918 3649 | 9423 | -0.002 | -0.2719 | No | ||
| 25 | TESK2 | 10504 | 9878 | -0.003 | -0.2962 | No | ||
| 26 | EAF1 | 3634 22055 | 11213 | -0.006 | -0.3675 | No | ||
| 27 | GADD45A | 17129 | 11554 | -0.007 | -0.3853 | No | ||
| 28 | RIMS4 | 14360 | 11909 | -0.008 | -0.4037 | No | ||
| 29 | MAP1A | 5124 | 12820 | -0.013 | -0.4517 | No | ||
| 30 | EIF4G2 | 1908 8892 | 14938 | -0.040 | -0.5627 | No | ||
| 31 | DTNA | 8870 4647 23611 1991 | 15315 | -0.050 | -0.5791 | No | ||
| 32 | ARCN1 | 19143 | 15967 | -0.078 | -0.6081 | No | ||
| 33 | CASP2 | 8692 | 16123 | -0.087 | -0.6098 | No | ||
| 34 | GNB1 | 15967 | 16431 | -0.109 | -0.6180 | No | ||
| 35 | XAB1 | 16881 | 16535 | -0.116 | -0.6146 | No | ||
| 36 | MAP2K4 | 20405 | 16690 | -0.131 | -0.6128 | No | ||
| 37 | PANK2 | 14838 | 17269 | -0.194 | -0.6290 | Yes | ||
| 38 | AKT3 | 13739 982 | 17357 | -0.204 | -0.6180 | Yes | ||
| 39 | MXI1 | 23813 5139 | 17987 | -0.319 | -0.6273 | Yes | ||
| 40 | EIF2S2 | 7406 14383 | 18228 | -0.440 | -0.6064 | Yes | ||
| 41 | ING4 | 6602 1155 1102 11371 | 18463 | -0.801 | -0.5574 | Yes | ||
| 42 | DOCK3 | 9920 5537 10751 | 18584 | -2.084 | -0.4036 | Yes | ||
| 43 | PABPC1 | 5219 9522 9523 23572 | 18615 | -5.269 | 0.0001 | Yes |