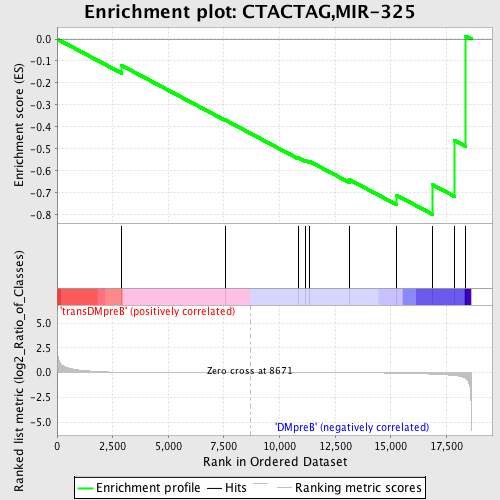
Profile of the Running ES Score & Positions of GeneSet Members on the Rank Ordered List
| Dataset | Set_04_transDMpreB_versus_DMpreB.phenotype_transDMpreB_versus_DMpreB.cls #transDMpreB_versus_DMpreB.phenotype_transDMpreB_versus_DMpreB.cls #transDMpreB_versus_DMpreB_repos |
| Phenotype | phenotype_transDMpreB_versus_DMpreB.cls#transDMpreB_versus_DMpreB_repos |
| Upregulated in class | DMpreB |
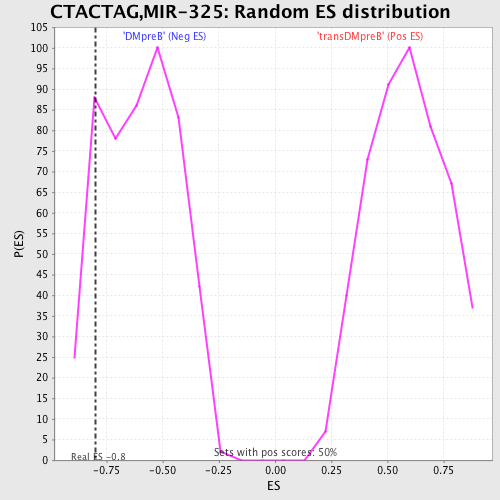
| GeneSet | CTACTAG,MIR-325 |
| Enrichment Score (ES) | -0.79846036 |
| Normalized Enrichment Score (NES) | -1.324929 |
| Nominal p-value | 0.13095239 |
| FDR q-value | 1.0 |
| FWER p-Value | 1.0 |
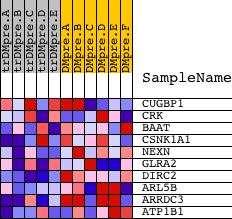
| PROBE | DESCRIPTION (from dataset) | GENE SYMBOL | GENE_TITLE | RANK IN GENE LIST | RANK METRIC SCORE | RUNNING ES | CORE ENRICHMENT | |
|---|---|---|---|---|---|---|---|---|
| 1 | CUGBP1 | 2805 8819 4576 2924 | 2904 | 0.040 | -0.1206 | No | ||
| 2 | CRK | 4559 1249 | 7552 | 0.002 | -0.3683 | No | ||
| 3 | BAAT | 15885 | 10841 | -0.005 | -0.5406 | No | ||
| 4 | CSNK1A1 | 8204 | 11164 | -0.006 | -0.5527 | No | ||
| 5 | NEXN | 12737 1903 | 11331 | -0.006 | -0.5560 | No | ||
| 6 | GLRA2 | 24008 | 13144 | -0.015 | -0.6404 | No | ||
| 7 | DIRC2 | 22603 | 15255 | -0.048 | -0.7109 | Yes | ||
| 8 | ARL5B | 15115 | 16885 | -0.152 | -0.6637 | Yes | ||
| 9 | ARRDC3 | 4191 | 17852 | -0.287 | -0.4611 | Yes | ||
| 10 | ATP1B1 | 4420 | 18372 | -0.566 | 0.0131 | Yes |