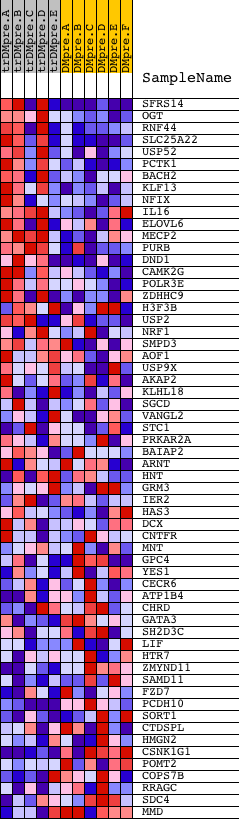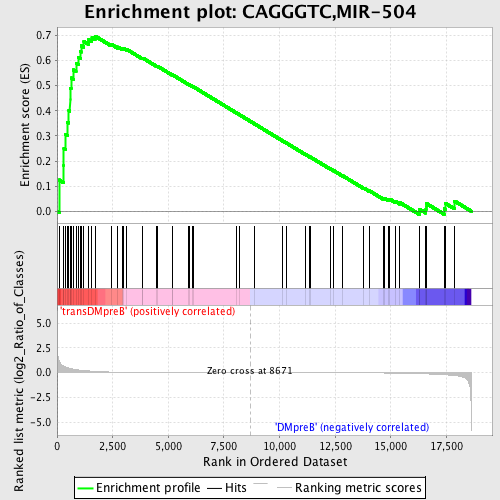
Profile of the Running ES Score & Positions of GeneSet Members on the Rank Ordered List
| Dataset | Set_04_transDMpreB_versus_DMpreB.phenotype_transDMpreB_versus_DMpreB.cls #transDMpreB_versus_DMpreB.phenotype_transDMpreB_versus_DMpreB.cls #transDMpreB_versus_DMpreB_repos |
| Phenotype | phenotype_transDMpreB_versus_DMpreB.cls#transDMpreB_versus_DMpreB_repos |
| Upregulated in class | transDMpreB |
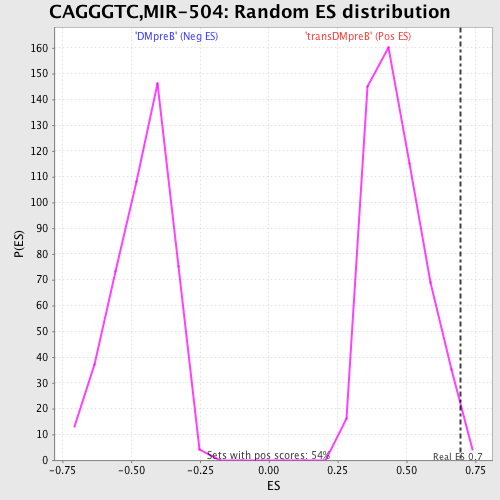
| GeneSet | CAGGGTC,MIR-504 |
| Enrichment Score (ES) | 0.69739753 |
| Normalized Enrichment Score (NES) | 1.5135689 |
| Nominal p-value | 0.009191177 |
| FDR q-value | 0.3994403 |
| FWER p-Value | 0.946 |
| PROBE | DESCRIPTION (from dataset) | GENE SYMBOL | GENE_TITLE | RANK IN GENE LIST | RANK METRIC SCORE | RUNNING ES | CORE ENRICHMENT | |
|---|---|---|---|---|---|---|---|---|
| 1 | SFRS14 | 10622 | 94 | 1.199 | 0.1246 | Yes | ||
| 2 | OGT | 4241 24274 | 300 | 0.635 | 0.1822 | Yes | ||
| 3 | RNF44 | 8364 | 306 | 0.631 | 0.2502 | Yes | ||
| 4 | SLC25A22 | 12671 | 386 | 0.551 | 0.3055 | Yes | ||
| 5 | USP52 | 3397 19841 | 462 | 0.492 | 0.3547 | Yes | ||
| 6 | PCTK1 | 24369 | 529 | 0.457 | 0.4006 | Yes | ||
| 7 | BACH2 | 8648 | 579 | 0.429 | 0.4444 | Yes | ||
| 8 | KLF13 | 17807 | 580 | 0.428 | 0.4906 | Yes | ||
| 9 | NFIX | 9458 | 630 | 0.396 | 0.5308 | Yes | ||
| 10 | IL16 | 9171 | 733 | 0.347 | 0.5628 | Yes | ||
| 11 | ELOVL6 | 5009 | 852 | 0.306 | 0.5895 | Yes | ||
| 12 | MECP2 | 5088 | 951 | 0.275 | 0.6140 | Yes | ||
| 13 | PURB | 5335 | 1055 | 0.247 | 0.6352 | Yes | ||
| 14 | DND1 | 10017 | 1078 | 0.239 | 0.6598 | Yes | ||
| 15 | CAMK2G | 21905 | 1204 | 0.210 | 0.6759 | Yes | ||
| 16 | POLR3E | 18100 | 1422 | 0.171 | 0.6827 | Yes | ||
| 17 | ZDHHC9 | 24163 | 1567 | 0.149 | 0.6911 | Yes | ||
| 18 | H3F3B | 4839 | 1708 | 0.128 | 0.6974 | Yes | ||
| 19 | USP2 | 19480 3052 3043 | 2434 | 0.060 | 0.6648 | No | ||
| 20 | NRF1 | 17499 | 2724 | 0.046 | 0.6542 | No | ||
| 21 | SMPD3 | 18757 | 2918 | 0.039 | 0.6481 | No | ||
| 22 | AOF1 | 5746 3207 3284 | 2963 | 0.038 | 0.6498 | No | ||
| 23 | USP9X | 10264 10265 5834 | 3117 | 0.034 | 0.6452 | No | ||
| 24 | AKAP2 | 8565 | 3836 | 0.020 | 0.6087 | No | ||
| 25 | KLHL18 | 11291 | 3849 | 0.020 | 0.6102 | No | ||
| 26 | SGCD | 1425 10779 | 4478 | 0.014 | 0.5778 | No | ||
| 27 | VANGL2 | 4109 8220 | 4496 | 0.013 | 0.5783 | No | ||
| 28 | STC1 | 21974 | 5176 | 0.009 | 0.5428 | No | ||
| 29 | PRKAR2A | 5287 | 5178 | 0.009 | 0.5437 | No | ||
| 30 | BAIAP2 | 449 4236 | 5890 | 0.007 | 0.5061 | No | ||
| 31 | ARNT | 4413 1857 | 5959 | 0.006 | 0.5032 | No | ||
| 32 | HNT | 10641 | 6101 | 0.006 | 0.4962 | No | ||
| 33 | GRM3 | 16929 | 6126 | 0.006 | 0.4956 | No | ||
| 34 | IER2 | 18815 | 8072 | 0.001 | 0.3909 | No | ||
| 35 | HAS3 | 18477 | 8177 | 0.001 | 0.3854 | No | ||
| 36 | DCX | 24040 8841 4604 | 8883 | -0.000 | 0.3474 | No | ||
| 37 | CNTFR | 2515 15906 | 10145 | -0.003 | 0.2799 | No | ||
| 38 | MNT | 20784 | 10328 | -0.004 | 0.2704 | No | ||
| 39 | GPC4 | 24153 | 11184 | -0.006 | 0.2250 | No | ||
| 40 | YES1 | 5930 | 11364 | -0.006 | 0.2161 | No | ||
| 41 | CECR6 | 17018 | 11375 | -0.006 | 0.2162 | No | ||
| 42 | ATP1B4 | 12586 | 12270 | -0.010 | 0.1691 | No | ||
| 43 | CHRD | 22817 | 12438 | -0.011 | 0.1612 | No | ||
| 44 | GATA3 | 9004 | 12840 | -0.013 | 0.1410 | No | ||
| 45 | SH2D3C | 2864 | 13786 | -0.020 | 0.0923 | No | ||
| 46 | LIF | 956 667 20960 | 14036 | -0.023 | 0.0813 | No | ||
| 47 | HTR7 | 23690 | 14690 | -0.034 | 0.0498 | No | ||
| 48 | ZMYND11 | 12364 3269 3286 3223 | 14737 | -0.035 | 0.0511 | No | ||
| 49 | SAMD11 | 15641 | 14884 | -0.038 | 0.0473 | No | ||
| 50 | FZD7 | 14242 | 14957 | -0.040 | 0.0478 | No | ||
| 51 | PCDH10 | 5227 9534 1893 | 15195 | -0.046 | 0.0400 | No | ||
| 52 | SORT1 | 15452 5475 9847 | 15411 | -0.053 | 0.0342 | No | ||
| 53 | CTDSPL | 19279 | 16287 | -0.098 | -0.0024 | No | ||
| 54 | HMGN2 | 9095 | 16299 | -0.098 | 0.0076 | No | ||
| 55 | CSNK1G1 | 3057 5671 19397 | 16576 | -0.120 | 0.0056 | No | ||
| 56 | POMT2 | 5731 | 16586 | -0.120 | 0.0182 | No | ||
| 57 | COPS7B | 6502 11222 | 16592 | -0.121 | 0.0311 | No | ||
| 58 | RRAGC | 12015 | 17398 | -0.210 | 0.0104 | No | ||
| 59 | SDC4 | 14349 | 17460 | -0.220 | 0.0309 | No | ||
| 60 | MMD | 20706 | 17862 | -0.290 | 0.0406 | No |