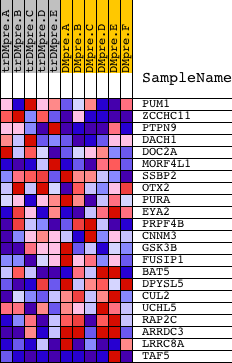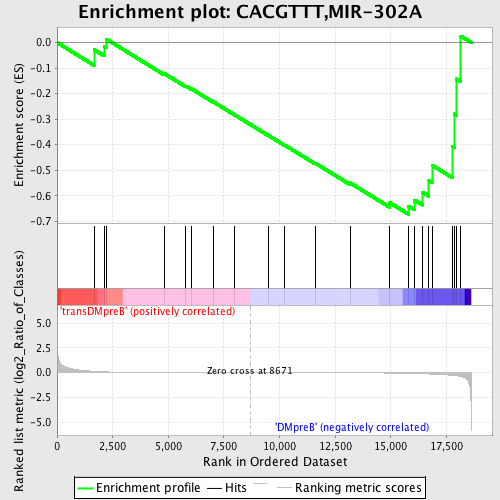
Profile of the Running ES Score & Positions of GeneSet Members on the Rank Ordered List
| Dataset | Set_04_transDMpreB_versus_DMpreB.phenotype_transDMpreB_versus_DMpreB.cls #transDMpreB_versus_DMpreB.phenotype_transDMpreB_versus_DMpreB.cls #transDMpreB_versus_DMpreB_repos |
| Phenotype | phenotype_transDMpreB_versus_DMpreB.cls#transDMpreB_versus_DMpreB_repos |
| Upregulated in class | DMpreB |
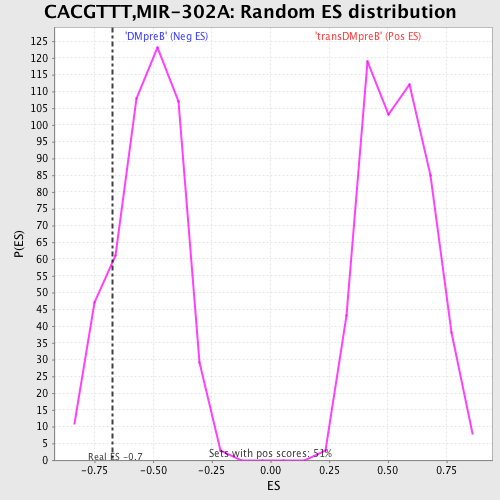
| GeneSet | CACGTTT,MIR-302A |
| Enrichment Score (ES) | -0.67336345 |
| Normalized Enrichment Score (NES) | -1.2858646 |
| Nominal p-value | 0.15337424 |
| FDR q-value | 0.95556647 |
| FWER p-Value | 1.0 |
| PROBE | DESCRIPTION (from dataset) | GENE SYMBOL | GENE_TITLE | RANK IN GENE LIST | RANK METRIC SCORE | RUNNING ES | CORE ENRICHMENT | |
|---|---|---|---|---|---|---|---|---|
| 1 | PUM1 | 8160 | 1663 | 0.135 | -0.0279 | No | ||
| 2 | ZCCHC11 | 6053 10500 | 2121 | 0.082 | -0.0151 | No | ||
| 3 | PTPN9 | 19434 | 2235 | 0.073 | 0.0121 | No | ||
| 4 | DACH1 | 4595 3371 | 4821 | 0.011 | -0.1217 | No | ||
| 5 | DOC2A | 18073 | 5789 | 0.007 | -0.1705 | No | ||
| 6 | MORF4L1 | 5723 | 6044 | 0.006 | -0.1814 | No | ||
| 7 | SSBP2 | 3171 7364 3252 | 7023 | 0.003 | -0.2324 | No | ||
| 8 | OTX2 | 9519 | 7990 | 0.001 | -0.2837 | No | ||
| 9 | PURA | 9670 | 9497 | -0.002 | -0.3639 | No | ||
| 10 | EYA2 | 2734 14729 | 10226 | -0.003 | -0.4014 | No | ||
| 11 | PRPF4B | 3208 5295 | 11605 | -0.007 | -0.4722 | No | ||
| 12 | CNNM3 | 4099 8250 | 13178 | -0.015 | -0.5500 | No | ||
| 13 | GSK3B | 22761 | 14935 | -0.040 | -0.6263 | No | ||
| 14 | FUSIP1 | 4715 16036 | 15811 | -0.070 | -0.6413 | Yes | ||
| 15 | BAT5 | 23261 | 16073 | -0.084 | -0.6170 | Yes | ||
| 16 | DPYSL5 | 92 | 16432 | -0.109 | -0.5865 | Yes | ||
| 17 | CUL2 | 23630 | 16712 | -0.133 | -0.5409 | Yes | ||
| 18 | UCHL5 | 4108 7076 | 16855 | -0.149 | -0.4804 | Yes | ||
| 19 | RAP2C | 24156 | 17775 | -0.269 | -0.4068 | Yes | ||
| 20 | ARRDC3 | 4191 | 17852 | -0.287 | -0.2798 | Yes | ||
| 21 | LRRC8A | 15054 | 17961 | -0.312 | -0.1428 | Yes | ||
| 22 | TAF5 | 23833 5934 3759 | 18151 | -0.389 | 0.0250 | Yes |