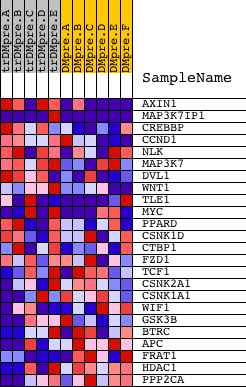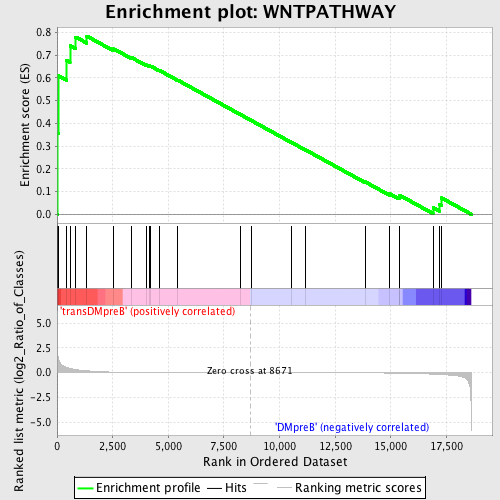
Profile of the Running ES Score & Positions of GeneSet Members on the Rank Ordered List
| Dataset | Set_04_transDMpreB_versus_DMpreB.phenotype_transDMpreB_versus_DMpreB.cls #transDMpreB_versus_DMpreB.phenotype_transDMpreB_versus_DMpreB.cls #transDMpreB_versus_DMpreB_repos |
| Phenotype | phenotype_transDMpreB_versus_DMpreB.cls#transDMpreB_versus_DMpreB_repos |
| Upregulated in class | transDMpreB |
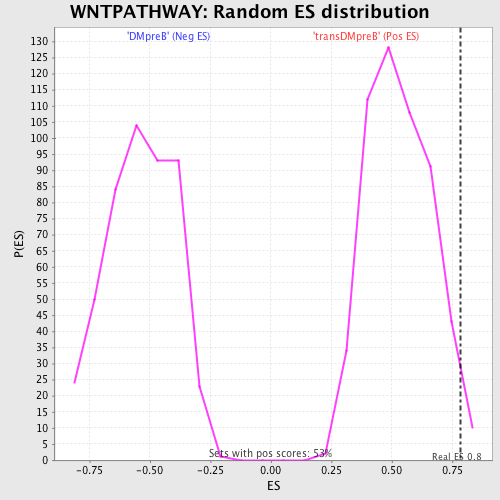
| GeneSet | WNTPATHWAY |
| Enrichment Score (ES) | 0.7838127 |
| Normalized Enrichment Score (NES) | 1.4774642 |
| Nominal p-value | 0.018939395 |
| FDR q-value | 0.85240674 |
| FWER p-Value | 1.0 |
| PROBE | DESCRIPTION (from dataset) | GENE SYMBOL | GENE_TITLE | RANK IN GENE LIST | RANK METRIC SCORE | RUNNING ES | CORE ENRICHMENT | |
|---|---|---|---|---|---|---|---|---|
| 1 | AXIN1 | 1579 23330 | 18 | 2.123 | 0.3561 | Yes | ||
| 2 | MAP3K7IP1 | 2193 2171 22419 | 59 | 1.517 | 0.6092 | Yes | ||
| 3 | CREBBP | 22682 8783 | 416 | 0.525 | 0.6783 | Yes | ||
| 4 | CCND1 | 4487 4488 8707 17535 | 581 | 0.427 | 0.7413 | Yes | ||
| 5 | NLK | 5179 5178 | 838 | 0.311 | 0.7798 | Yes | ||
| 6 | MAP3K7 | 16255 | 1335 | 0.182 | 0.7838 | Yes | ||
| 7 | DVL1 | 2412 15960 | 2550 | 0.053 | 0.7274 | No | ||
| 8 | WNT1 | 22371 | 3341 | 0.028 | 0.6897 | No | ||
| 9 | TLE1 | 5765 10185 15859 | 4007 | 0.018 | 0.6569 | No | ||
| 10 | MYC | 22465 9435 | 4133 | 0.017 | 0.6530 | No | ||
| 11 | PPARD | 9606 | 4208 | 0.016 | 0.6517 | No | ||
| 12 | CSNK1D | 4181 8352 1387 | 4589 | 0.013 | 0.6334 | No | ||
| 13 | CTBP1 | 16566 | 5423 | 0.008 | 0.5900 | No | ||
| 14 | FZD1 | 16923 | 8227 | 0.001 | 0.4394 | No | ||
| 15 | TCF1 | 16416 | 8752 | -0.000 | 0.4112 | No | ||
| 16 | CSNK2A1 | 14797 | 10540 | -0.004 | 0.3158 | No | ||
| 17 | CSNK1A1 | 8204 | 11164 | -0.006 | 0.2833 | No | ||
| 18 | WIF1 | 19866 | 13853 | -0.021 | 0.1423 | No | ||
| 19 | GSK3B | 22761 | 14935 | -0.040 | 0.0908 | No | ||
| 20 | BTRC | 4459 | 15374 | -0.051 | 0.0759 | No | ||
| 21 | APC | 4396 2022 | 15406 | -0.053 | 0.0831 | No | ||
| 22 | FRAT1 | 3681 23856 | 16898 | -0.154 | 0.0287 | No | ||
| 23 | HDAC1 | 9081 | 17174 | -0.183 | 0.0447 | No | ||
| 24 | PPP2CA | 20890 | 17280 | -0.195 | 0.0719 | No |