Profile of the Running ES Score & Positions of GeneSet Members on the Rank Ordered List
| Dataset | Set_04_transDMpreB_versus_DMpreB.phenotype_transDMpreB_versus_DMpreB.cls #transDMpreB_versus_DMpreB.phenotype_transDMpreB_versus_DMpreB.cls #transDMpreB_versus_DMpreB_repos |
| Phenotype | phenotype_transDMpreB_versus_DMpreB.cls#transDMpreB_versus_DMpreB_repos |
| Upregulated in class | DMpreB |
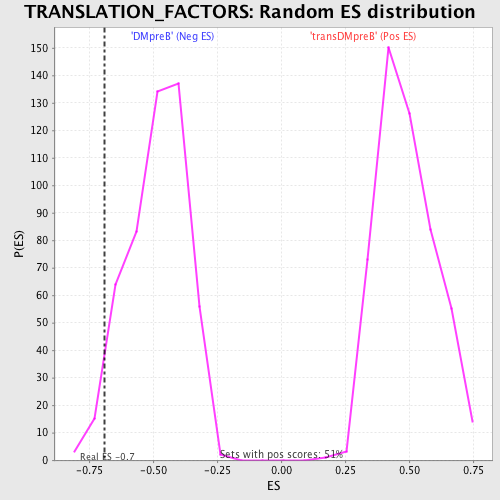
| GeneSet | TRANSLATION_FACTORS |
| Enrichment Score (ES) | -0.69108975 |
| Normalized Enrichment Score (NES) | -1.4283633 |
| Nominal p-value | 0.032388665 |
| FDR q-value | 0.5266865 |
| FWER p-Value | 1.0 |
| PROBE | DESCRIPTION (from dataset) | GENE SYMBOL | GENE_TITLE | RANK IN GENE LIST | RANK METRIC SCORE | RUNNING ES | CORE ENRICHMENT | |
|---|---|---|---|---|---|---|---|---|
| 1 | EIF4G3 | 10517 | 78 | 1.323 | 0.0731 | No | ||
| 2 | EIF4G1 | 22818 | 537 | 0.453 | 0.0748 | No | ||
| 3 | EIF5 | 5736 | 727 | 0.350 | 0.0851 | No | ||
| 4 | EIF4EBP2 | 4662 | 742 | 0.343 | 0.1044 | No | ||
| 5 | EIF2AK2 | 22892 | 1010 | 0.258 | 0.1051 | No | ||
| 6 | EIF2AK3 | 17421 | 1616 | 0.142 | 0.0808 | No | ||
| 7 | EIF5A | 11345 20379 6590 | 1868 | 0.108 | 0.0736 | No | ||
| 8 | EIF2B4 | 16574 | 2186 | 0.076 | 0.0610 | No | ||
| 9 | SLC35A4 | 12588 | 2303 | 0.068 | 0.0587 | No | ||
| 10 | EEF2 | 8881 4654 8882 | 2539 | 0.054 | 0.0492 | No | ||
| 11 | EEF1G | 12480 | 2901 | 0.040 | 0.0321 | No | ||
| 12 | EEF2K | 18101 | 3337 | 0.028 | 0.0103 | No | ||
| 13 | EIF3S1 | 905 8114 | 4696 | 0.012 | -0.0621 | No | ||
| 14 | EIF2S1 | 4658 | 5504 | 0.008 | -0.1051 | No | ||
| 15 | PAIP1 | 21556 | 6496 | 0.005 | -0.1582 | No | ||
| 16 | EIF3S5 | 18131 | 7367 | 0.003 | -0.2048 | No | ||
| 17 | EIF4A2 | 4660 1679 1645 | 8430 | 0.000 | -0.2620 | No | ||
| 18 | EIF5B | 10391 5963 | 11156 | -0.006 | -0.4084 | No | ||
| 19 | GSPT2 | 4806 | 11958 | -0.008 | -0.4510 | No | ||
| 20 | EIF4E | 15403 1827 8890 | 12487 | -0.011 | -0.4788 | No | ||
| 21 | EIF4EBP1 | 8891 4661 | 13670 | -0.019 | -0.5413 | No | ||
| 22 | EEF1A2 | 8880 14309 | 13854 | -0.021 | -0.5499 | No | ||
| 23 | EIF4A1 | 8889 23719 | 15134 | -0.045 | -0.6162 | No | ||
| 24 | EIF3S8 | 7099 12100 | 15161 | -0.045 | -0.6149 | No | ||
| 25 | EEF1B2 | 4131 12063 | 16101 | -0.085 | -0.6605 | No | ||
| 26 | EIF2AK1 | 4869 | 16208 | -0.093 | -0.6608 | No | ||
| 27 | EIF3S7 | 22226 | 16403 | -0.105 | -0.6651 | No | ||
| 28 | EEF1D | 12393 2309 | 16546 | -0.116 | -0.6659 | No | ||
| 29 | EIF3S4 | 6588 11988 | 16732 | -0.134 | -0.6681 | No | ||
| 30 | EIF3S2 | 15744 2342 2478 | 16780 | -0.139 | -0.6625 | No | ||
| 31 | ETF1 | 23467 | 16974 | -0.162 | -0.6634 | No | ||
| 32 | EIF2B2 | 21204 | 17490 | -0.223 | -0.6781 | Yes | ||
| 33 | EIF2B1 | 16368 3458 | 17541 | -0.230 | -0.6673 | Yes | ||
| 34 | EIF2B3 | 16118 | 17939 | -0.308 | -0.6707 | Yes | ||
| 35 | ITGB4BP | 9191 | 18033 | -0.332 | -0.6563 | Yes | ||
| 36 | EIF2S2 | 7406 14383 | 18228 | -0.440 | -0.6411 | Yes | ||
| 37 | EIF3S3 | 12652 | 18317 | -0.498 | -0.6167 | Yes | ||
| 38 | EIF3S9 | 16643 3528 | 18360 | -0.549 | -0.5869 | Yes | ||
| 39 | EIF3S6 | 4924 | 18384 | -0.585 | -0.5540 | Yes | ||
| 40 | EIF3S10 | 4659 8887 | 18500 | -0.972 | -0.5034 | Yes | ||
| 41 | EIF2B5 | 1719 22822 | 18547 | -1.386 | -0.4250 | Yes | ||
| 42 | EIF1AY | 2643 24219 | 18582 | -2.069 | -0.3059 | Yes | ||
| 43 | PABPC1 | 5219 9522 9523 23572 | 18615 | -5.269 | 0.0001 | Yes |