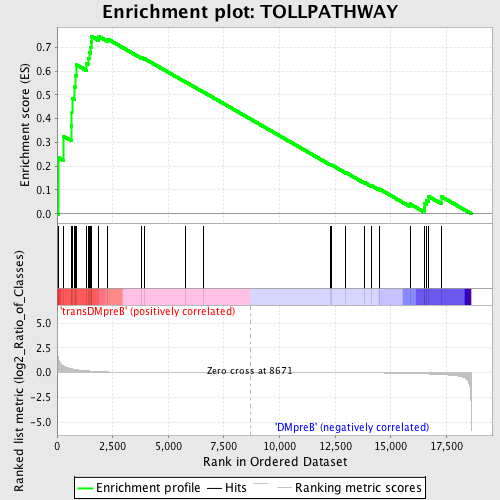
Profile of the Running ES Score & Positions of GeneSet Members on the Rank Ordered List
| Dataset | Set_04_transDMpreB_versus_DMpreB.phenotype_transDMpreB_versus_DMpreB.cls #transDMpreB_versus_DMpreB.phenotype_transDMpreB_versus_DMpreB.cls #transDMpreB_versus_DMpreB_repos |
| Phenotype | phenotype_transDMpreB_versus_DMpreB.cls#transDMpreB_versus_DMpreB_repos |
| Upregulated in class | transDMpreB |
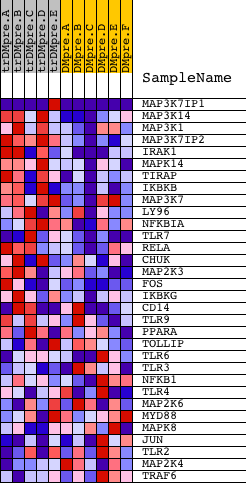
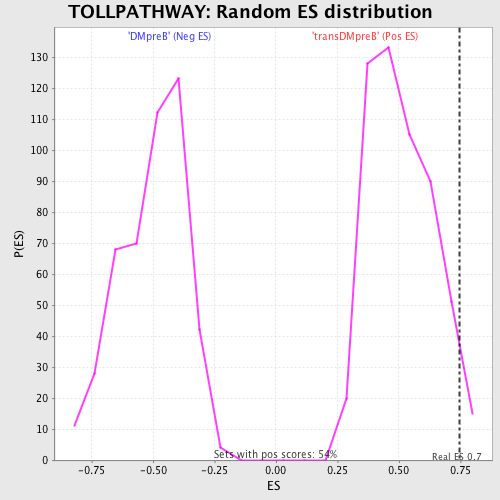
| GeneSet | TOLLPATHWAY |
| Enrichment Score (ES) | 0.747526 |
| Normalized Enrichment Score (NES) | 1.463401 |
| Nominal p-value | 0.03505535 |
| FDR q-value | 0.7734467 |
| FWER p-Value | 1.0 |
| PROBE | DESCRIPTION (from dataset) | GENE SYMBOL | GENE_TITLE | RANK IN GENE LIST | RANK METRIC SCORE | RUNNING ES | CORE ENRICHMENT | |
|---|---|---|---|---|---|---|---|---|
| 1 | MAP3K7IP1 | 2193 2171 22419 | 59 | 1.517 | 0.2360 | Yes | ||
| 2 | MAP3K14 | 11998 | 291 | 0.648 | 0.3258 | Yes | ||
| 3 | MAP3K1 | 21348 | 633 | 0.393 | 0.3694 | Yes | ||
| 4 | MAP3K7IP2 | 19827 | 667 | 0.380 | 0.4275 | Yes | ||
| 5 | IRAK1 | 4916 | 670 | 0.378 | 0.4870 | Yes | ||
| 6 | MAPK14 | 23313 | 774 | 0.331 | 0.5337 | Yes | ||
| 7 | TIRAP | 3075 19187 | 810 | 0.320 | 0.5823 | Yes | ||
| 8 | IKBKB | 4907 | 861 | 0.304 | 0.6275 | Yes | ||
| 9 | MAP3K7 | 16255 | 1335 | 0.182 | 0.6308 | Yes | ||
| 10 | LY96 | 14292 | 1396 | 0.175 | 0.6551 | Yes | ||
| 11 | NFKBIA | 21065 | 1447 | 0.167 | 0.6787 | Yes | ||
| 12 | TLR7 | 24004 | 1517 | 0.156 | 0.6996 | Yes | ||
| 13 | RELA | 23783 | 1532 | 0.154 | 0.7232 | Yes | ||
| 14 | CHUK | 23665 | 1559 | 0.150 | 0.7454 | Yes | ||
| 15 | MAP2K3 | 20856 | 1847 | 0.111 | 0.7475 | Yes | ||
| 16 | FOS | 21202 | 2284 | 0.069 | 0.7349 | No | ||
| 17 | IKBKG | 2570 2562 4908 | 3770 | 0.021 | 0.6583 | No | ||
| 18 | CD14 | 23452 | 3948 | 0.019 | 0.6517 | No | ||
| 19 | TLR9 | 19331 3127 | 5787 | 0.007 | 0.5539 | No | ||
| 20 | PPARA | 22397 | 6579 | 0.005 | 0.5121 | No | ||
| 21 | TOLLIP | 7039 12038 | 12269 | -0.010 | 0.2075 | No | ||
| 22 | TLR6 | 215 16528 | 12328 | -0.010 | 0.2060 | No | ||
| 23 | TLR3 | 18884 | 12979 | -0.014 | 0.1731 | No | ||
| 24 | NFKB1 | 15160 | 13838 | -0.021 | 0.1303 | No | ||
| 25 | TLR4 | 2329 10191 5770 | 14147 | -0.024 | 0.1175 | No | ||
| 26 | MAP2K6 | 20614 1414 | 14483 | -0.030 | 0.1042 | No | ||
| 27 | MYD88 | 18970 | 15863 | -0.073 | 0.0414 | No | ||
| 28 | MAPK8 | 6459 | 16496 | -0.113 | 0.0252 | No | ||
| 29 | JUN | 15832 | 16520 | -0.114 | 0.0420 | No | ||
| 30 | TLR2 | 15308 | 16615 | -0.123 | 0.0564 | No | ||
| 31 | MAP2K4 | 20405 | 16690 | -0.131 | 0.0731 | No | ||
| 32 | TRAF6 | 5797 14940 | 17265 | -0.193 | 0.0727 | No |