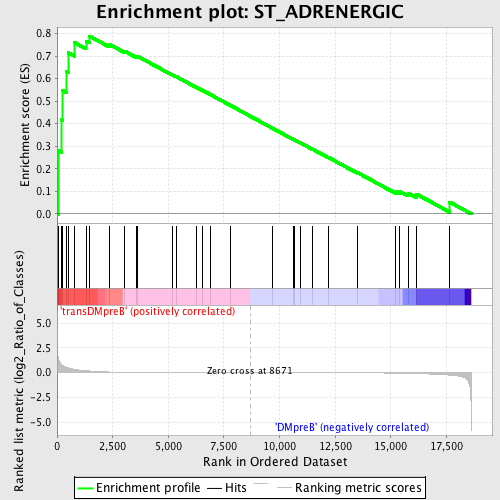
Profile of the Running ES Score & Positions of GeneSet Members on the Rank Ordered List
| Dataset | Set_04_transDMpreB_versus_DMpreB.phenotype_transDMpreB_versus_DMpreB.cls #transDMpreB_versus_DMpreB.phenotype_transDMpreB_versus_DMpreB.cls #transDMpreB_versus_DMpreB_repos |
| Phenotype | phenotype_transDMpreB_versus_DMpreB.cls#transDMpreB_versus_DMpreB_repos |
| Upregulated in class | transDMpreB |
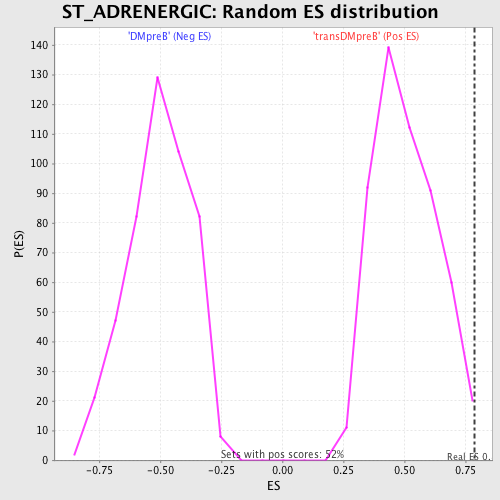
| GeneSet | ST_ADRENERGIC |
| Enrichment Score (ES) | 0.7882552 |
| Normalized Enrichment Score (NES) | 1.5567499 |
| Nominal p-value | 0.00952381 |
| FDR q-value | 0.89507586 |
| FWER p-Value | 0.877 |
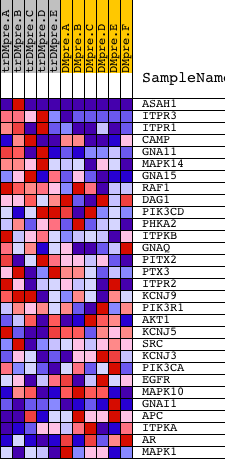
| PROBE | DESCRIPTION (from dataset) | GENE SYMBOL | GENE_TITLE | RANK IN GENE LIST | RANK METRIC SCORE | RUNNING ES | CORE ENRICHMENT | |
|---|---|---|---|---|---|---|---|---|
| 1 | ASAH1 | 3835 3853 8630 | 50 | 1.559 | 0.2811 | Yes | ||
| 2 | ITPR3 | 9195 | 202 | 0.792 | 0.4171 | Yes | ||
| 3 | ITPR1 | 17341 | 237 | 0.732 | 0.5485 | Yes | ||
| 4 | CAMP | 18990 | 429 | 0.516 | 0.6320 | Yes | ||
| 5 | GNA11 | 3300 3345 19670 | 505 | 0.472 | 0.7139 | Yes | ||
| 6 | MAPK14 | 23313 | 774 | 0.331 | 0.7598 | Yes | ||
| 7 | GNA15 | 19671 | 1299 | 0.191 | 0.7663 | Yes | ||
| 8 | RAF1 | 17035 | 1454 | 0.166 | 0.7883 | Yes | ||
| 9 | DAG1 | 18996 8837 | 2341 | 0.065 | 0.7525 | No | ||
| 10 | PIK3CD | 9563 | 3036 | 0.036 | 0.7217 | No | ||
| 11 | PHKA2 | 8471 24216 | 3584 | 0.024 | 0.6965 | No | ||
| 12 | ITPKB | 3963 14028 | 3605 | 0.023 | 0.6997 | No | ||
| 13 | GNAQ | 4786 23909 3685 | 5192 | 0.009 | 0.6161 | No | ||
| 14 | PITX2 | 15424 1878 | 5354 | 0.009 | 0.6090 | No | ||
| 15 | PTX3 | 9668 15575 | 6265 | 0.006 | 0.5611 | No | ||
| 16 | ITPR2 | 9194 | 6512 | 0.005 | 0.5487 | No | ||
| 17 | KCNJ9 | 9210 | 6884 | 0.004 | 0.5295 | No | ||
| 18 | PIK3R1 | 3170 | 7781 | 0.002 | 0.4816 | No | ||
| 19 | AKT1 | 8568 | 9661 | -0.002 | 0.3809 | No | ||
| 20 | KCNJ5 | 9209 | 10632 | -0.004 | 0.3295 | No | ||
| 21 | SRC | 5507 | 10684 | -0.005 | 0.3276 | No | ||
| 22 | KCNJ3 | 4944 | 10931 | -0.005 | 0.3153 | No | ||
| 23 | PIK3CA | 9562 | 11488 | -0.007 | 0.2866 | No | ||
| 24 | EGFR | 1329 20944 | 12193 | -0.009 | 0.2505 | No | ||
| 25 | MAPK10 | 11169 | 13486 | -0.017 | 0.1841 | No | ||
| 26 | GNAI1 | 9024 | 15230 | -0.048 | 0.0990 | No | ||
| 27 | APC | 4396 2022 | 15406 | -0.053 | 0.0992 | No | ||
| 28 | ITPKA | 14898 | 15774 | -0.069 | 0.0919 | No | ||
| 29 | AR | 24286 | 16167 | -0.090 | 0.0872 | No | ||
| 30 | MAPK1 | 1642 11167 | 17642 | -0.244 | 0.0524 | No |