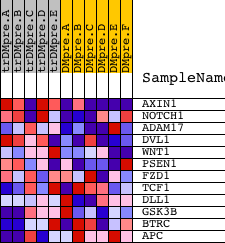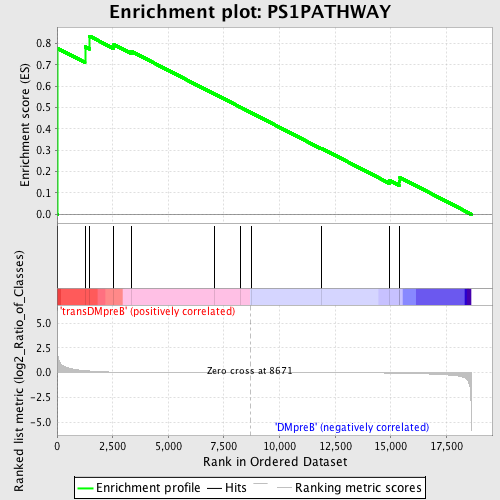
Profile of the Running ES Score & Positions of GeneSet Members on the Rank Ordered List
| Dataset | Set_04_transDMpreB_versus_DMpreB.phenotype_transDMpreB_versus_DMpreB.cls #transDMpreB_versus_DMpreB.phenotype_transDMpreB_versus_DMpreB.cls #transDMpreB_versus_DMpreB_repos |
| Phenotype | phenotype_transDMpreB_versus_DMpreB.cls#transDMpreB_versus_DMpreB_repos |
| Upregulated in class | transDMpreB |
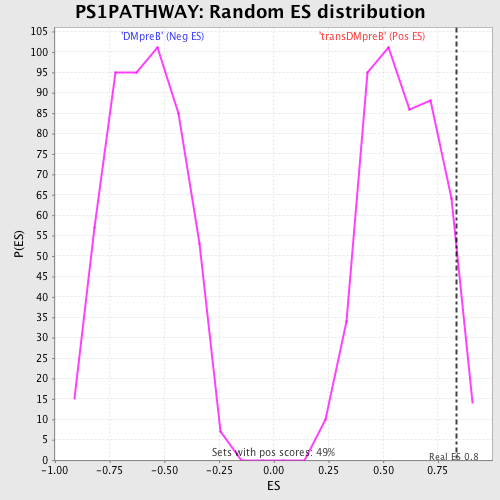
| GeneSet | PS1PATHWAY |
| Enrichment Score (ES) | 0.83484375 |
| Normalized Enrichment Score (NES) | 1.4276947 |
| Nominal p-value | 0.040650405 |
| FDR q-value | 0.86623913 |
| FWER p-Value | 1.0 |
| PROBE | DESCRIPTION (from dataset) | GENE SYMBOL | GENE_TITLE | RANK IN GENE LIST | RANK METRIC SCORE | RUNNING ES | CORE ENRICHMENT | |
|---|---|---|---|---|---|---|---|---|
| 1 | AXIN1 | 1579 23330 | 18 | 2.123 | 0.7775 | Yes | ||
| 2 | NOTCH1 | 14649 | 1254 | 0.201 | 0.7850 | Yes | ||
| 3 | ADAM17 | 4343 | 1456 | 0.165 | 0.8348 | Yes | ||
| 4 | DVL1 | 2412 15960 | 2550 | 0.053 | 0.7955 | No | ||
| 5 | WNT1 | 22371 | 3341 | 0.028 | 0.7633 | No | ||
| 6 | PSEN1 | 5297 2125 9630 | 7081 | 0.003 | 0.5636 | No | ||
| 7 | FZD1 | 16923 | 8227 | 0.001 | 0.5024 | No | ||
| 8 | TCF1 | 16416 | 8752 | -0.000 | 0.4743 | No | ||
| 9 | DLL1 | 23119 | 11884 | -0.008 | 0.3090 | No | ||
| 10 | GSK3B | 22761 | 14935 | -0.040 | 0.1596 | No | ||
| 11 | BTRC | 4459 | 15374 | -0.051 | 0.1549 | No | ||
| 12 | APC | 4396 2022 | 15406 | -0.053 | 0.1725 | No |