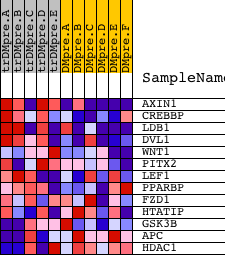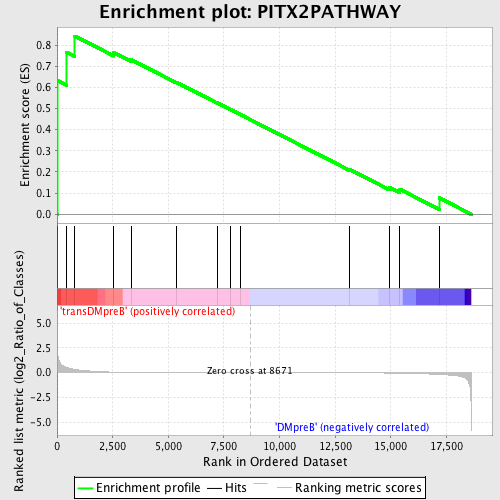
Profile of the Running ES Score & Positions of GeneSet Members on the Rank Ordered List
| Dataset | Set_04_transDMpreB_versus_DMpreB.phenotype_transDMpreB_versus_DMpreB.cls #transDMpreB_versus_DMpreB.phenotype_transDMpreB_versus_DMpreB.cls #transDMpreB_versus_DMpreB_repos |
| Phenotype | phenotype_transDMpreB_versus_DMpreB.cls#transDMpreB_versus_DMpreB_repos |
| Upregulated in class | transDMpreB |
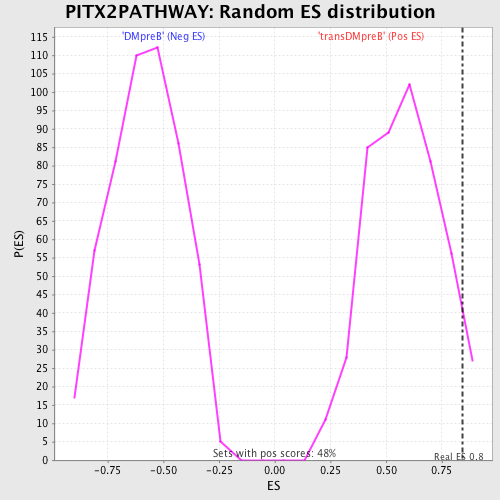
| GeneSet | PITX2PATHWAY |
| Enrichment Score (ES) | 0.8423646 |
| Normalized Enrichment Score (NES) | 1.4492685 |
| Nominal p-value | 0.050104383 |
| FDR q-value | 0.7820154 |
| FWER p-Value | 1.0 |
| PROBE | DESCRIPTION (from dataset) | GENE SYMBOL | GENE_TITLE | RANK IN GENE LIST | RANK METRIC SCORE | RUNNING ES | CORE ENRICHMENT | |
|---|---|---|---|---|---|---|---|---|
| 1 | AXIN1 | 1579 23330 | 18 | 2.123 | 0.6316 | Yes | ||
| 2 | CREBBP | 22682 8783 | 416 | 0.525 | 0.7666 | Yes | ||
| 3 | LDB1 | 23654 | 800 | 0.323 | 0.8424 | Yes | ||
| 4 | DVL1 | 2412 15960 | 2550 | 0.053 | 0.7641 | No | ||
| 5 | WNT1 | 22371 | 3341 | 0.028 | 0.7300 | No | ||
| 6 | PITX2 | 15424 1878 | 5354 | 0.009 | 0.6245 | No | ||
| 7 | LEF1 | 1860 15420 | 7191 | 0.003 | 0.5267 | No | ||
| 8 | PPARBP | 1203 20263 1195 | 7790 | 0.002 | 0.4951 | No | ||
| 9 | FZD1 | 16923 | 8227 | 0.001 | 0.4719 | No | ||
| 10 | HTATIP | 3690 | 13163 | -0.015 | 0.2111 | No | ||
| 11 | GSK3B | 22761 | 14935 | -0.040 | 0.1277 | No | ||
| 12 | APC | 4396 2022 | 15406 | -0.053 | 0.1181 | No | ||
| 13 | HDAC1 | 9081 | 17174 | -0.183 | 0.0775 | No |