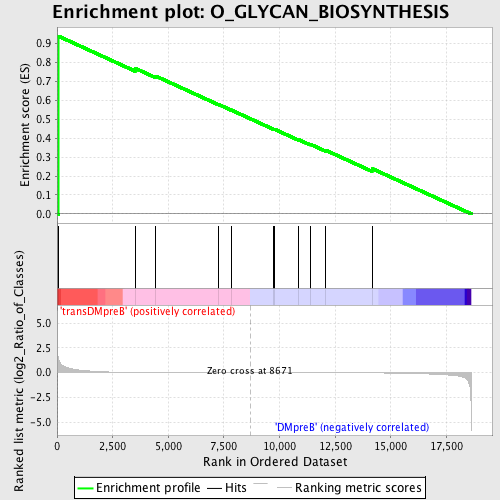
Profile of the Running ES Score & Positions of GeneSet Members on the Rank Ordered List
| Dataset | Set_04_transDMpreB_versus_DMpreB.phenotype_transDMpreB_versus_DMpreB.cls #transDMpreB_versus_DMpreB.phenotype_transDMpreB_versus_DMpreB.cls #transDMpreB_versus_DMpreB_repos |
| Phenotype | phenotype_transDMpreB_versus_DMpreB.cls#transDMpreB_versus_DMpreB_repos |
| Upregulated in class | transDMpreB |
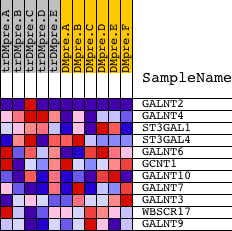
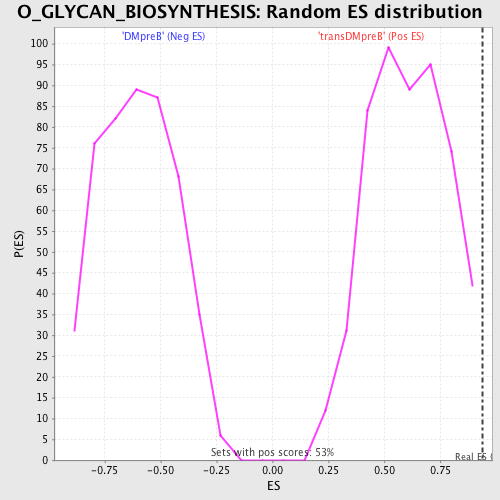
| GeneSet | O_GLYCAN_BIOSYNTHESIS |
| Enrichment Score (ES) | 0.9396993 |
| Normalized Enrichment Score (NES) | 1.5524514 |
| Nominal p-value | 0.0019011407 |
| FDR q-value | 0.71824765 |
| FWER p-Value | 0.898 |
| PROBE | DESCRIPTION (from dataset) | GENE SYMBOL | GENE_TITLE | RANK IN GENE LIST | RANK METRIC SCORE | RUNNING ES | CORE ENRICHMENT | |
|---|---|---|---|---|---|---|---|---|
| 1 | GALNT2 | 4239 18424 | 56 | 1.528 | 0.9397 | Yes | ||
| 2 | GALNT4 | 19892 | 3505 | 0.025 | 0.7697 | No | ||
| 3 | ST3GAL1 | 5435 2227 | 4425 | 0.014 | 0.7289 | No | ||
| 4 | ST3GAL4 | 9816 | 7267 | 0.003 | 0.5780 | No | ||
| 5 | GALNT6 | 22126 | 7819 | 0.002 | 0.5494 | No | ||
| 6 | GCNT1 | 23715 3749 3689 | 9719 | -0.002 | 0.4488 | No | ||
| 7 | GALNT10 | 9345 1269 | 9790 | -0.002 | 0.4466 | No | ||
| 8 | GALNT7 | 18870 | 10859 | -0.005 | 0.3923 | No | ||
| 9 | GALNT3 | 4751 | 11382 | -0.006 | 0.3682 | No | ||
| 10 | WBSCR17 | 16357 | 12064 | -0.009 | 0.3371 | No | ||
| 11 | GALNT9 | 16753 | 14156 | -0.024 | 0.2397 | No |