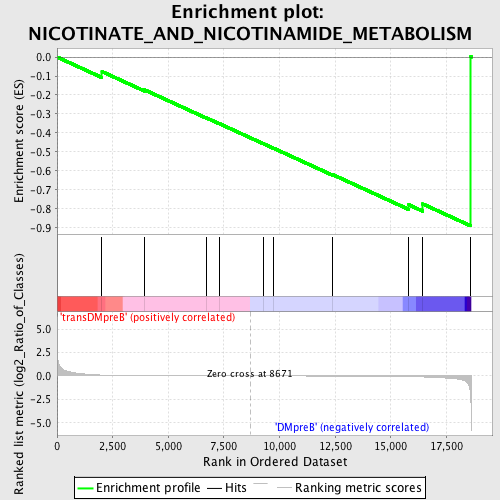
Profile of the Running ES Score & Positions of GeneSet Members on the Rank Ordered List
| Dataset | Set_04_transDMpreB_versus_DMpreB.phenotype_transDMpreB_versus_DMpreB.cls #transDMpreB_versus_DMpreB.phenotype_transDMpreB_versus_DMpreB.cls #transDMpreB_versus_DMpreB_repos |
| Phenotype | phenotype_transDMpreB_versus_DMpreB.cls#transDMpreB_versus_DMpreB_repos |
| Upregulated in class | DMpreB |
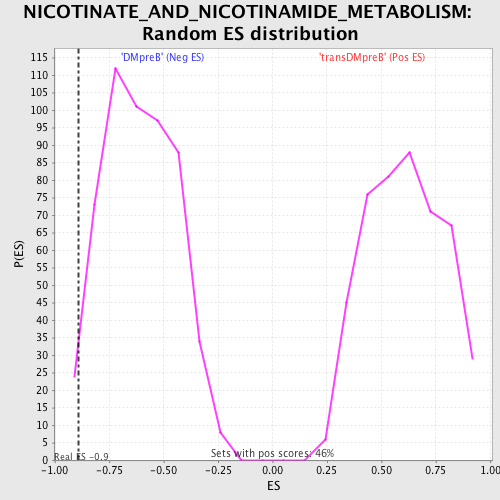
| GeneSet | NICOTINATE_AND_NICOTINAMIDE_METABOLISM |
| Enrichment Score (ES) | -0.89035857 |
| Normalized Enrichment Score (NES) | -1.4578481 |
| Nominal p-value | 0.022346368 |
| FDR q-value | 0.4501528 |
| FWER p-Value | 1.0 |
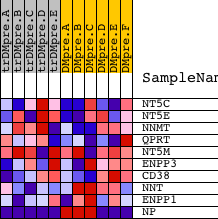
| PROBE | DESCRIPTION (from dataset) | GENE SYMBOL | GENE_TITLE | RANK IN GENE LIST | RANK METRIC SCORE | RUNNING ES | CORE ENRICHMENT | |
|---|---|---|---|---|---|---|---|---|
| 1 | NT5C | 20151 | 2016 | 0.091 | -0.0766 | No | ||
| 2 | NT5E | 19360 18702 | 3931 | 0.019 | -0.1729 | No | ||
| 3 | NNMT | 19131 | 6714 | 0.004 | -0.3209 | No | ||
| 4 | QPRT | 17626 | 7300 | 0.003 | -0.3513 | No | ||
| 5 | NT5M | 8345 4175 | 9267 | -0.001 | -0.4565 | No | ||
| 6 | ENPP3 | 19803 | 9728 | -0.002 | -0.4804 | No | ||
| 7 | CD38 | 16849 | 12393 | -0.010 | -0.6200 | No | ||
| 8 | NNT | 3273 5181 9471 3238 | 15808 | -0.070 | -0.7789 | Yes | ||
| 9 | ENPP1 | 19804 | 16437 | -0.109 | -0.7743 | Yes | ||
| 10 | NP | 22027 9597 5273 5274 | 18597 | -2.542 | 0.0010 | Yes |