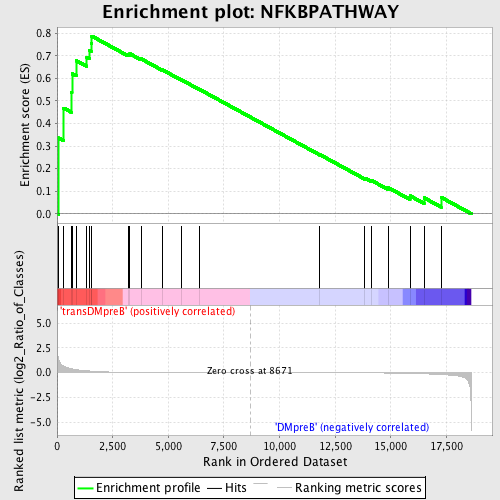
Profile of the Running ES Score & Positions of GeneSet Members on the Rank Ordered List
| Dataset | Set_04_transDMpreB_versus_DMpreB.phenotype_transDMpreB_versus_DMpreB.cls #transDMpreB_versus_DMpreB.phenotype_transDMpreB_versus_DMpreB.cls #transDMpreB_versus_DMpreB_repos |
| Phenotype | phenotype_transDMpreB_versus_DMpreB.cls#transDMpreB_versus_DMpreB_repos |
| Upregulated in class | transDMpreB |
| GeneSet | NFKBPATHWAY |
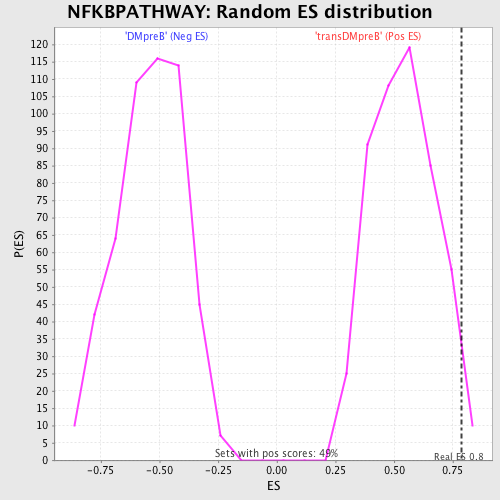
| Enrichment Score (ES) | 0.7874691 |
| Normalized Enrichment Score (NES) | 1.4632112 |
| Nominal p-value | 0.020283977 |
| FDR q-value | 0.7196772 |
| FWER p-Value | 1.0 |
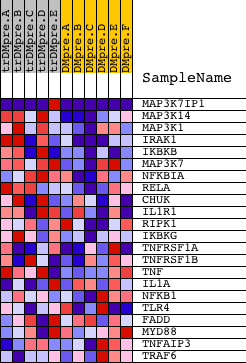
| PROBE | DESCRIPTION (from dataset) | GENE SYMBOL | GENE_TITLE | RANK IN GENE LIST | RANK METRIC SCORE | RUNNING ES | CORE ENRICHMENT | |
|---|---|---|---|---|---|---|---|---|
| 1 | MAP3K7IP1 | 2193 2171 22419 | 59 | 1.517 | 0.3362 | Yes | ||
| 2 | MAP3K14 | 11998 | 291 | 0.648 | 0.4687 | Yes | ||
| 3 | MAP3K1 | 21348 | 633 | 0.393 | 0.5383 | Yes | ||
| 4 | IRAK1 | 4916 | 670 | 0.378 | 0.6210 | Yes | ||
| 5 | IKBKB | 4907 | 861 | 0.304 | 0.6786 | Yes | ||
| 6 | MAP3K7 | 16255 | 1335 | 0.182 | 0.6940 | Yes | ||
| 7 | NFKBIA | 21065 | 1447 | 0.167 | 0.7254 | Yes | ||
| 8 | RELA | 23783 | 1532 | 0.154 | 0.7553 | Yes | ||
| 9 | CHUK | 23665 | 1559 | 0.150 | 0.7875 | Yes | ||
| 10 | IL1R1 | 14264 3987 | 3197 | 0.032 | 0.7065 | No | ||
| 11 | RIPK1 | 5381 | 3271 | 0.030 | 0.7092 | No | ||
| 12 | IKBKG | 2570 2562 4908 | 3770 | 0.021 | 0.6871 | No | ||
| 13 | TNFRSF1A | 1181 10206 | 4724 | 0.012 | 0.6385 | No | ||
| 14 | TNFRSF1B | 5782 2346 | 5588 | 0.008 | 0.5938 | No | ||
| 15 | TNF | 23004 | 6407 | 0.005 | 0.5510 | No | ||
| 16 | IL1A | 4915 | 11814 | -0.008 | 0.2620 | No | ||
| 17 | NFKB1 | 15160 | 13838 | -0.021 | 0.1579 | No | ||
| 18 | TLR4 | 2329 10191 5770 | 14147 | -0.024 | 0.1468 | No | ||
| 19 | FADD | 17536 8950 4711 | 14894 | -0.039 | 0.1153 | No | ||
| 20 | MYD88 | 18970 | 15863 | -0.073 | 0.0795 | No | ||
| 21 | TNFAIP3 | 19810 | 16497 | -0.113 | 0.0707 | No | ||
| 22 | TRAF6 | 5797 14940 | 17265 | -0.193 | 0.0727 | No |