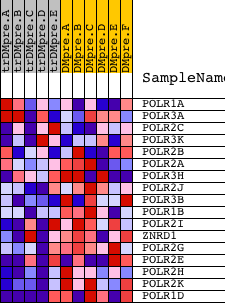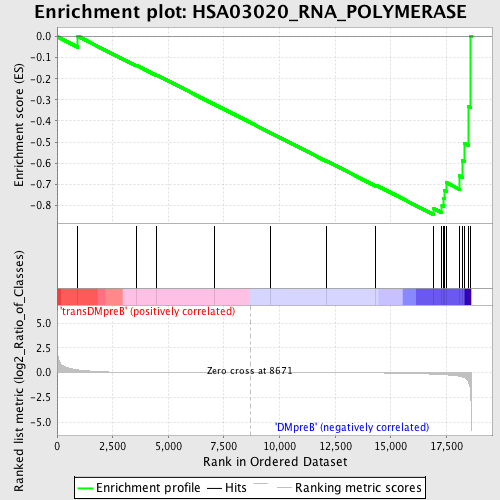
Profile of the Running ES Score & Positions of GeneSet Members on the Rank Ordered List
| Dataset | Set_04_transDMpreB_versus_DMpreB.phenotype_transDMpreB_versus_DMpreB.cls #transDMpreB_versus_DMpreB.phenotype_transDMpreB_versus_DMpreB.cls #transDMpreB_versus_DMpreB_repos |
| Phenotype | phenotype_transDMpreB_versus_DMpreB.cls#transDMpreB_versus_DMpreB_repos |
| Upregulated in class | DMpreB |
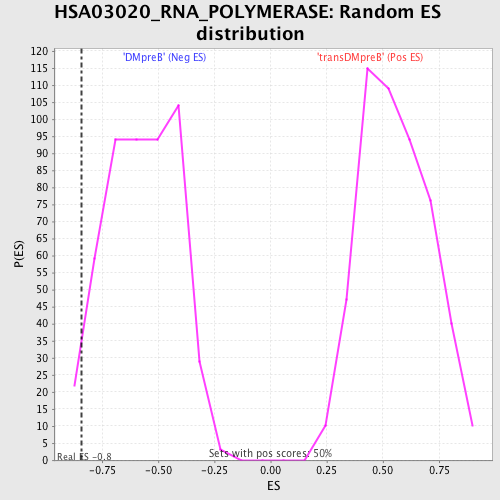
| GeneSet | HSA03020_RNA_POLYMERASE |
| Enrichment Score (ES) | -0.8432677 |
| Normalized Enrichment Score (NES) | -1.4715145 |
| Nominal p-value | 0.036072146 |
| FDR q-value | 0.4931571 |
| FWER p-Value | 1.0 |
| PROBE | DESCRIPTION (from dataset) | GENE SYMBOL | GENE_TITLE | RANK IN GENE LIST | RANK METRIC SCORE | RUNNING ES | CORE ENRICHMENT | |
|---|---|---|---|---|---|---|---|---|
| 1 | POLR1A | 9749 5393 | 933 | 0.282 | 0.0013 | No | ||
| 2 | POLR3A | 21900 | 3553 | 0.024 | -0.1352 | No | ||
| 3 | POLR2C | 9750 | 4477 | 0.014 | -0.1823 | No | ||
| 4 | POLR3K | 12447 7372 | 7065 | 0.003 | -0.3208 | No | ||
| 5 | POLR2B | 16817 | 9609 | -0.002 | -0.4571 | No | ||
| 6 | POLR2A | 5394 | 12103 | -0.009 | -0.5895 | No | ||
| 7 | POLR3H | 13460 8135 | 14320 | -0.027 | -0.7038 | No | ||
| 8 | POLR2J | 16672 | 16916 | -0.155 | -0.8150 | Yes | ||
| 9 | POLR3B | 12875 | 17298 | -0.198 | -0.7993 | Yes | ||
| 10 | POLR1B | 14857 | 17382 | -0.208 | -0.7659 | Yes | ||
| 11 | POLR2I | 12839 | 17404 | -0.211 | -0.7284 | Yes | ||
| 12 | ZNRD1 | 1491 22987 | 17501 | -0.225 | -0.6925 | Yes | ||
| 13 | POLR2G | 23753 | 18082 | -0.349 | -0.6599 | Yes | ||
| 14 | POLR2E | 3325 19699 | 18208 | -0.425 | -0.5891 | Yes | ||
| 15 | POLR2H | 10888 | 18302 | -0.486 | -0.5053 | Yes | ||
| 16 | POLR2K | 9413 | 18504 | -1.001 | -0.3332 | Yes | ||
| 17 | POLR1D | 3593 3658 16623 | 18577 | -1.857 | 0.0021 | Yes |