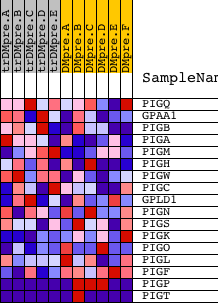
Profile of the Running ES Score & Positions of GeneSet Members on the Rank Ordered List
| Dataset | Set_04_transDMpreB_versus_DMpreB.phenotype_transDMpreB_versus_DMpreB.cls #transDMpreB_versus_DMpreB.phenotype_transDMpreB_versus_DMpreB.cls #transDMpreB_versus_DMpreB_repos |
| Phenotype | phenotype_transDMpreB_versus_DMpreB.cls#transDMpreB_versus_DMpreB_repos |
| Upregulated in class | DMpreB |
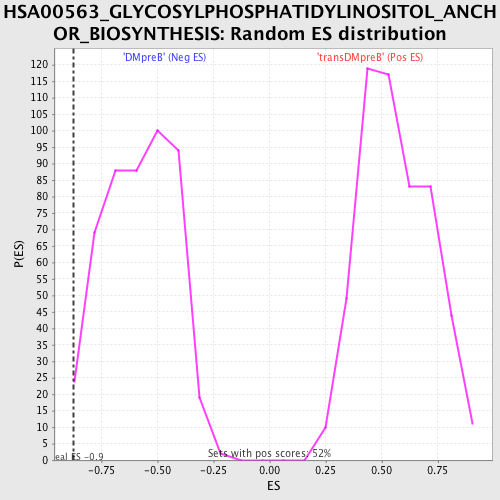
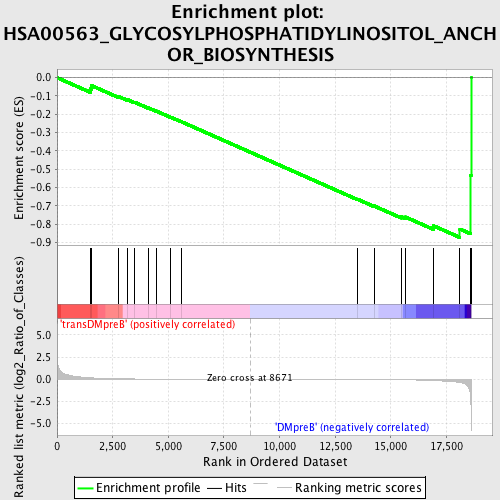
| GeneSet | HSA00563_GLYCOSYLPHOSPHATIDYLINOSITOL_ANCHOR_BIOSYNTHESIS |
| Enrichment Score (ES) | -0.8729335 |
| Normalized Enrichment Score (NES) | -1.5030049 |
| Nominal p-value | 0.01446281 |
| FDR q-value | 0.5442733 |
| FWER p-Value | 0.996 |
| PROBE | DESCRIPTION (from dataset) | GENE SYMBOL | GENE_TITLE | RANK IN GENE LIST | RANK METRIC SCORE | RUNNING ES | CORE ENRICHMENT | |
|---|---|---|---|---|---|---|---|---|
| 1 | PIGQ | 4798 4797 | 1514 | 0.156 | -0.0613 | No | ||
| 2 | GPAA1 | 22446 | 1541 | 0.153 | -0.0431 | No | ||
| 3 | PIGB | 3128 12067 | 2766 | 0.044 | -0.1032 | No | ||
| 4 | PIGA | 2592 24210 | 3155 | 0.033 | -0.1199 | No | ||
| 5 | PIGM | 14046 | 3462 | 0.026 | -0.1331 | No | ||
| 6 | PIGH | 8483 | 4094 | 0.017 | -0.1648 | No | ||
| 7 | PIGW | 20312 | 4450 | 0.014 | -0.1821 | No | ||
| 8 | PIGC | 14081 | 5116 | 0.010 | -0.2166 | No | ||
| 9 | GPLD1 | 21691 3272 | 5574 | 0.008 | -0.2402 | No | ||
| 10 | PIGN | 13865 | 13505 | -0.018 | -0.6643 | No | ||
| 11 | PIGS | 11347 | 14243 | -0.026 | -0.7006 | No | ||
| 12 | PIGK | 1815 6834 11629 | 15475 | -0.055 | -0.7597 | No | ||
| 13 | PIGO | 15903 2488 2344 | 15652 | -0.063 | -0.7611 | No | ||
| 14 | PIGL | 11595 | 16910 | -0.155 | -0.8088 | No | ||
| 15 | PIGF | 22879 | 18104 | -0.357 | -0.8271 | Yes | ||
| 16 | PIGP | 12082 1665 | 18593 | -2.484 | -0.5343 | Yes | ||
| 17 | PIGT | 8134 1 | 18611 | -4.171 | 0.0003 | Yes |