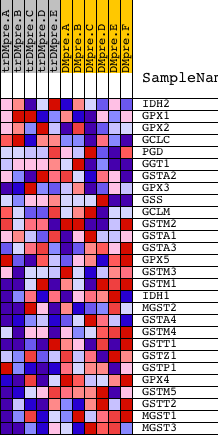
Profile of the Running ES Score & Positions of GeneSet Members on the Rank Ordered List
| Dataset | Set_04_transDMpreB_versus_DMpreB.phenotype_transDMpreB_versus_DMpreB.cls #transDMpreB_versus_DMpreB.phenotype_transDMpreB_versus_DMpreB.cls #transDMpreB_versus_DMpreB_repos |
| Phenotype | phenotype_transDMpreB_versus_DMpreB.cls#transDMpreB_versus_DMpreB_repos |
| Upregulated in class | DMpreB |
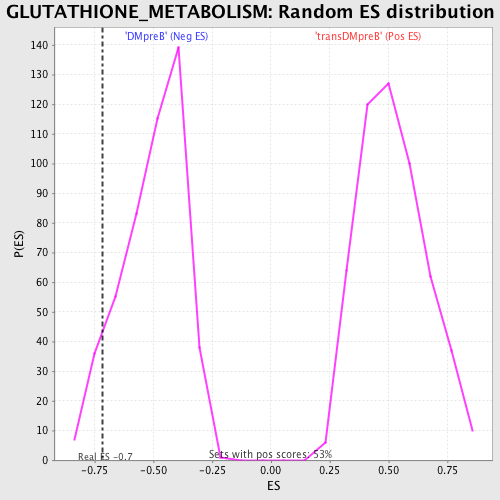
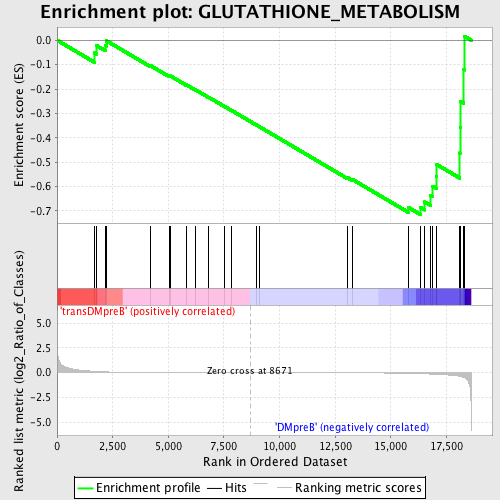
| GeneSet | GLUTATHIONE_METABOLISM |
| Enrichment Score (ES) | -0.71471244 |
| Normalized Enrichment Score (NES) | -1.4192752 |
| Nominal p-value | 0.08227848 |
| FDR q-value | 0.48153284 |
| FWER p-Value | 1.0 |
| PROBE | DESCRIPTION (from dataset) | GENE SYMBOL | GENE_TITLE | RANK IN GENE LIST | RANK METRIC SCORE | RUNNING ES | CORE ENRICHMENT | |
|---|---|---|---|---|---|---|---|---|
| 1 | IDH2 | 17781 | 1677 | 0.133 | -0.0519 | No | ||
| 2 | GPX1 | 19310 | 1767 | 0.122 | -0.0214 | No | ||
| 3 | GPX2 | 9037 | 2179 | 0.077 | -0.0214 | No | ||
| 4 | GCLC | 19374 | 2223 | 0.074 | -0.0024 | No | ||
| 5 | PGD | 8475 | 4180 | 0.016 | -0.1030 | No | ||
| 6 | GGT1 | 19987 | 5043 | 0.010 | -0.1464 | No | ||
| 7 | GSTA2 | 4808 6173 | 5094 | 0.010 | -0.1463 | No | ||
| 8 | GPX3 | 20880 | 5803 | 0.007 | -0.1824 | No | ||
| 9 | GSS | 14380 9047 | 6214 | 0.006 | -0.2028 | No | ||
| 10 | GCLM | 9019 | 6806 | 0.004 | -0.2334 | No | ||
| 11 | GSTM2 | 9049 4810 | 7506 | 0.002 | -0.2703 | No | ||
| 12 | GSTA1 | 4807 | 7854 | 0.002 | -0.2885 | No | ||
| 13 | GSTA3 | 14287 | 8943 | -0.001 | -0.3469 | No | ||
| 14 | GPX5 | 21532 3242 | 9105 | -0.001 | -0.3553 | No | ||
| 15 | GSTM3 | 9050 | 13053 | -0.014 | -0.5636 | No | ||
| 16 | GSTM1 | 4809 9048 | 13294 | -0.016 | -0.5719 | No | ||
| 17 | IDH1 | 4894 | 15804 | -0.070 | -0.6867 | Yes | ||
| 18 | MGST2 | 15597 | 16326 | -0.100 | -0.6858 | Yes | ||
| 19 | GSTA4 | 19371 | 16524 | -0.115 | -0.6632 | Yes | ||
| 20 | GSTM4 | 15199 | 16783 | -0.140 | -0.6368 | Yes | ||
| 21 | GSTT1 | 19730 | 16872 | -0.151 | -0.5979 | Yes | ||
| 22 | GSTZ1 | 21193 | 17043 | -0.169 | -0.5581 | Yes | ||
| 23 | GSTP1 | 9051 4812 4811 | 17055 | -0.171 | -0.5093 | Yes | ||
| 24 | GPX4 | 9038 | 18102 | -0.357 | -0.4624 | Yes | ||
| 25 | GSTM5 | 15455 | 18113 | -0.361 | -0.3586 | Yes | ||
| 26 | GSTT2 | 9052 | 18137 | -0.378 | -0.2506 | Yes | ||
| 27 | MGST1 | 17254 | 18284 | -0.474 | -0.1213 | Yes | ||
| 28 | MGST3 | 13771 12349 | 18298 | -0.481 | 0.0171 | Yes |