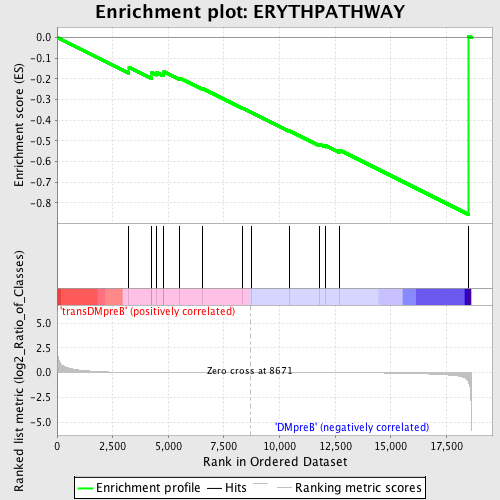
Profile of the Running ES Score & Positions of GeneSet Members on the Rank Ordered List
| Dataset | Set_04_transDMpreB_versus_DMpreB.phenotype_transDMpreB_versus_DMpreB.cls #transDMpreB_versus_DMpreB.phenotype_transDMpreB_versus_DMpreB.cls #transDMpreB_versus_DMpreB_repos |
| Phenotype | phenotype_transDMpreB_versus_DMpreB.cls#transDMpreB_versus_DMpreB_repos |
| Upregulated in class | DMpreB |
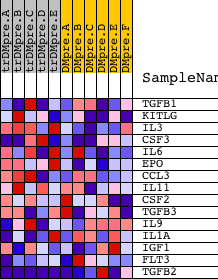
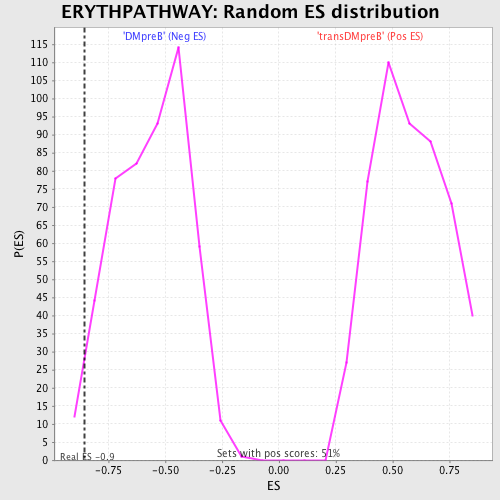
| GeneSet | ERYTHPATHWAY |
| Enrichment Score (ES) | -0.8566107 |
| Normalized Enrichment Score (NES) | -1.5271114 |
| Nominal p-value | 0.024291499 |
| FDR q-value | 0.4666722 |
| FWER p-Value | 0.981 |
| PROBE | DESCRIPTION (from dataset) | GENE SYMBOL | GENE_TITLE | RANK IN GENE LIST | RANK METRIC SCORE | RUNNING ES | CORE ENRICHMENT | |
|---|---|---|---|---|---|---|---|---|
| 1 | TGFB1 | 18332 | 3230 | 0.031 | -0.1447 | No | ||
| 2 | KITLG | 19889 3342 | 4230 | 0.016 | -0.1837 | No | ||
| 3 | IL3 | 20453 | 4232 | 0.016 | -0.1691 | No | ||
| 4 | CSF3 | 1394 20671 | 4462 | 0.014 | -0.1685 | No | ||
| 5 | IL6 | 16895 | 4767 | 0.012 | -0.1738 | No | ||
| 6 | EPO | 8911 | 4801 | 0.011 | -0.1648 | No | ||
| 7 | CCL3 | 20317 | 5519 | 0.008 | -0.1958 | No | ||
| 8 | IL11 | 17981 | 6556 | 0.005 | -0.2471 | No | ||
| 9 | CSF2 | 20454 | 8345 | 0.001 | -0.3426 | No | ||
| 10 | TGFB3 | 10161 | 8719 | -0.000 | -0.3625 | No | ||
| 11 | IL9 | 21444 | 10435 | -0.004 | -0.4509 | No | ||
| 12 | IL1A | 4915 | 11814 | -0.008 | -0.5175 | No | ||
| 13 | IGF1 | 3352 9156 3409 | 12045 | -0.009 | -0.5216 | No | ||
| 14 | FLT3 | 16288 | 12693 | -0.012 | -0.5452 | Yes | ||
| 15 | TGFB2 | 5743 | 18487 | -0.915 | 0.0069 | Yes |