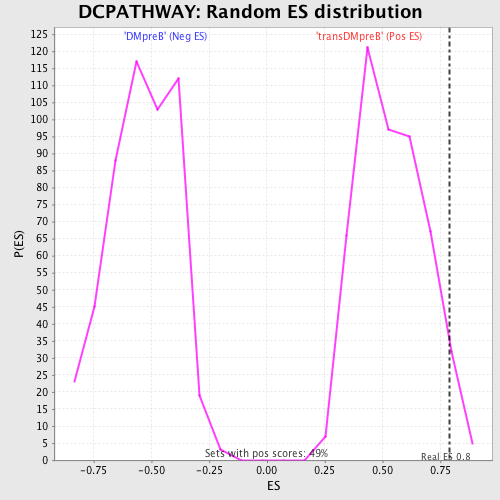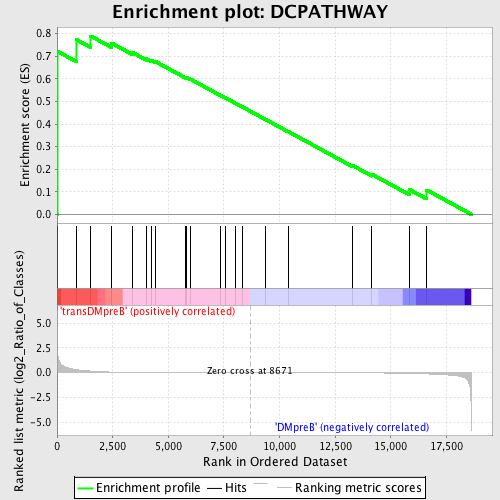
Profile of the Running ES Score & Positions of GeneSet Members on the Rank Ordered List
| Dataset | Set_04_transDMpreB_versus_DMpreB.phenotype_transDMpreB_versus_DMpreB.cls #transDMpreB_versus_DMpreB.phenotype_transDMpreB_versus_DMpreB.cls #transDMpreB_versus_DMpreB_repos |
| Phenotype | phenotype_transDMpreB_versus_DMpreB.cls#transDMpreB_versus_DMpreB_repos |
| Upregulated in class | transDMpreB |
| GeneSet | DCPATHWAY |
| Enrichment Score (ES) | 0.789265 |
| Normalized Enrichment Score (NES) | 1.4673021 |
| Nominal p-value | 0.036734693 |
| FDR q-value | 0.8017177 |
| FWER p-Value | 1.0 |
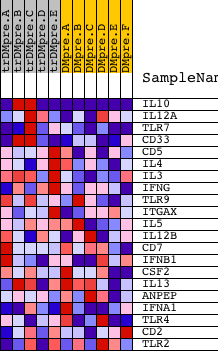
| PROBE | DESCRIPTION (from dataset) | GENE SYMBOL | GENE_TITLE | RANK IN GENE LIST | RANK METRIC SCORE | RUNNING ES | CORE ENRICHMENT | |
|---|---|---|---|---|---|---|---|---|
| 1 | IL10 | 14145 1510 1553 22902 | 14 | 2.242 | 0.7219 | Yes | ||
| 2 | IL12A | 4913 | 864 | 0.303 | 0.7739 | Yes | ||
| 3 | TLR7 | 24004 | 1517 | 0.156 | 0.7893 | Yes | ||
| 4 | CD33 | 17851 | 2451 | 0.059 | 0.7582 | No | ||
| 5 | CD5 | 23741 | 3373 | 0.027 | 0.7174 | No | ||
| 6 | IL4 | 9174 | 4010 | 0.018 | 0.6890 | No | ||
| 7 | IL3 | 20453 | 4232 | 0.016 | 0.6822 | No | ||
| 8 | IFNG | 19869 | 4409 | 0.014 | 0.6772 | No | ||
| 9 | TLR9 | 19331 3127 | 5787 | 0.007 | 0.6054 | No | ||
| 10 | ITGAX | 18058 | 5823 | 0.007 | 0.6058 | No | ||
| 11 | IL5 | 20884 10220 | 6004 | 0.006 | 0.5981 | No | ||
| 12 | IL12B | 20918 | 7351 | 0.003 | 0.5266 | No | ||
| 13 | CD7 | 20105 | 7579 | 0.002 | 0.5151 | No | ||
| 14 | IFNB1 | 15846 | 8030 | 0.001 | 0.4914 | No | ||
| 15 | CSF2 | 20454 | 8345 | 0.001 | 0.4747 | No | ||
| 16 | IL13 | 20461 | 9345 | -0.001 | 0.4214 | No | ||
| 17 | ANPEP | 17784 | 10386 | -0.004 | 0.3668 | No | ||
| 18 | IFNA1 | 9147 | 13280 | -0.016 | 0.2162 | No | ||
| 19 | TLR4 | 2329 10191 5770 | 14147 | -0.024 | 0.1775 | No | ||
| 20 | CD2 | 15223 | 15836 | -0.071 | 0.1097 | No | ||
| 21 | TLR2 | 15308 | 16615 | -0.123 | 0.1076 | No |