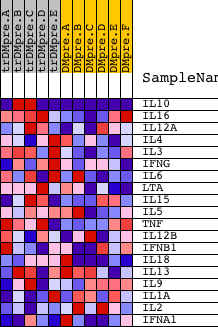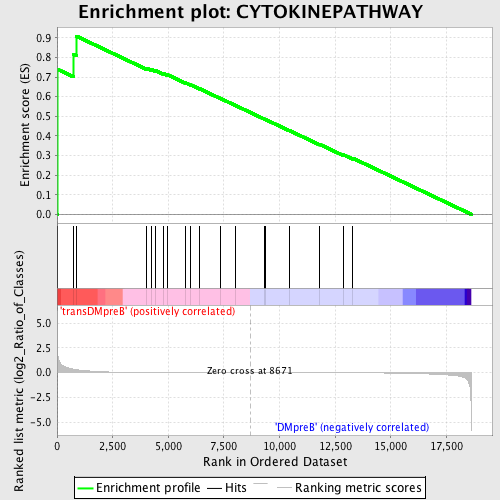
Profile of the Running ES Score & Positions of GeneSet Members on the Rank Ordered List
| Dataset | Set_04_transDMpreB_versus_DMpreB.phenotype_transDMpreB_versus_DMpreB.cls #transDMpreB_versus_DMpreB.phenotype_transDMpreB_versus_DMpreB.cls #transDMpreB_versus_DMpreB_repos |
| Phenotype | phenotype_transDMpreB_versus_DMpreB.cls#transDMpreB_versus_DMpreB_repos |
| Upregulated in class | transDMpreB |
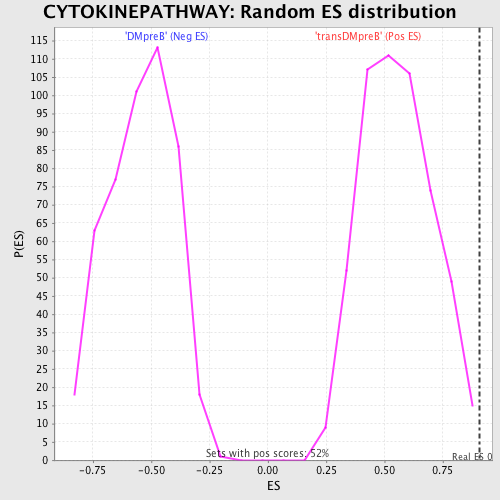
| GeneSet | CYTOKINEPATHWAY |
| Enrichment Score (ES) | 0.90889865 |
| Normalized Enrichment Score (NES) | 1.6335366 |
| Nominal p-value | 0.009560229 |
| FDR q-value | 0.57219326 |
| FWER p-Value | 0.359 |
| PROBE | DESCRIPTION (from dataset) | GENE SYMBOL | GENE_TITLE | RANK IN GENE LIST | RANK METRIC SCORE | RUNNING ES | CORE ENRICHMENT | |
|---|---|---|---|---|---|---|---|---|
| 1 | IL10 | 14145 1510 1553 22902 | 14 | 2.242 | 0.7399 | Yes | ||
| 2 | IL16 | 9171 | 733 | 0.347 | 0.8157 | Yes | ||
| 3 | IL12A | 4913 | 864 | 0.303 | 0.9089 | Yes | ||
| 4 | IL4 | 9174 | 4010 | 0.018 | 0.7457 | No | ||
| 5 | IL3 | 20453 | 4232 | 0.016 | 0.7390 | No | ||
| 6 | IFNG | 19869 | 4409 | 0.014 | 0.7342 | No | ||
| 7 | IL6 | 16895 | 4767 | 0.012 | 0.7188 | No | ||
| 8 | LTA | 23003 | 4961 | 0.011 | 0.7119 | No | ||
| 9 | IL15 | 18826 3801 | 5774 | 0.007 | 0.6706 | No | ||
| 10 | IL5 | 20884 10220 | 6004 | 0.006 | 0.6604 | No | ||
| 11 | TNF | 23004 | 6407 | 0.005 | 0.6404 | No | ||
| 12 | IL12B | 20918 | 7351 | 0.003 | 0.5906 | No | ||
| 13 | IFNB1 | 15846 | 8030 | 0.001 | 0.5546 | No | ||
| 14 | IL18 | 9172 | 9316 | -0.001 | 0.4860 | No | ||
| 15 | IL13 | 20461 | 9345 | -0.001 | 0.4849 | No | ||
| 16 | IL9 | 21444 | 10435 | -0.004 | 0.4277 | No | ||
| 17 | IL1A | 4915 | 11814 | -0.008 | 0.3562 | No | ||
| 18 | IL2 | 15354 | 12851 | -0.013 | 0.3048 | No | ||
| 19 | IFNA1 | 9147 | 13280 | -0.016 | 0.2869 | No |