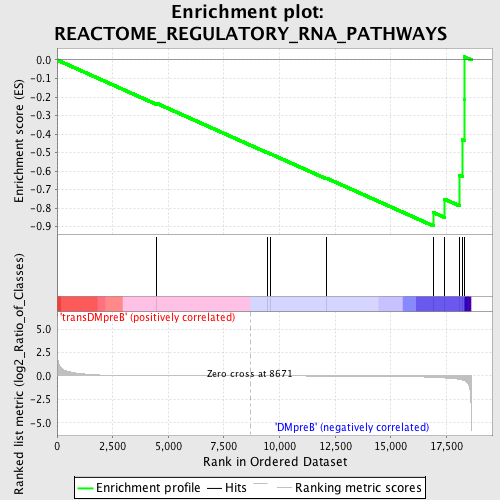
Profile of the Running ES Score & Positions of GeneSet Members on the Rank Ordered List
| Dataset | Set_04_transDMpreB_versus_DMpreB.phenotype_transDMpreB_versus_DMpreB.cls #transDMpreB_versus_DMpreB.phenotype_transDMpreB_versus_DMpreB.cls #transDMpreB_versus_DMpreB_repos |
| Phenotype | phenotype_transDMpreB_versus_DMpreB.cls#transDMpreB_versus_DMpreB_repos |
| Upregulated in class | DMpreB |
| GeneSet | REACTOME_REGULATORY_RNA_PATHWAYS |
| Enrichment Score (ES) | -0.89654934 |
| Normalized Enrichment Score (NES) | -1.4885365 |
| Nominal p-value | 0.02834008 |
| FDR q-value | 0.62746084 |
| FWER p-Value | 1.0 |
| PROBE | DESCRIPTION (from dataset) | GENE SYMBOL | GENE_TITLE | RANK IN GENE LIST | RANK METRIC SCORE | RUNNING ES | CORE ENRICHMENT | |
|---|---|---|---|---|---|---|---|---|
| 1 | POLR2C | 9750 | 4477 | 0.014 | -0.2342 | No | ||
| 2 | RAN | 5356 9691 | 9464 | -0.002 | -0.5014 | No | ||
| 3 | POLR2B | 16817 | 9609 | -0.002 | -0.5082 | No | ||
| 4 | POLR2A | 5394 | 12103 | -0.009 | -0.6379 | No | ||
| 5 | POLR2J | 16672 | 16916 | -0.155 | -0.8239 | Yes | ||
| 6 | POLR2I | 12839 | 17404 | -0.211 | -0.7511 | Yes | ||
| 7 | POLR2G | 23753 | 18082 | -0.349 | -0.6238 | Yes | ||
| 8 | POLR2E | 3325 19699 | 18208 | -0.425 | -0.4315 | Yes | ||
| 9 | TARBP2 | 10033 10034 5626 | 18297 | -0.481 | -0.2109 | Yes | ||
| 10 | POLR2H | 10888 | 18302 | -0.486 | 0.0169 | Yes |

