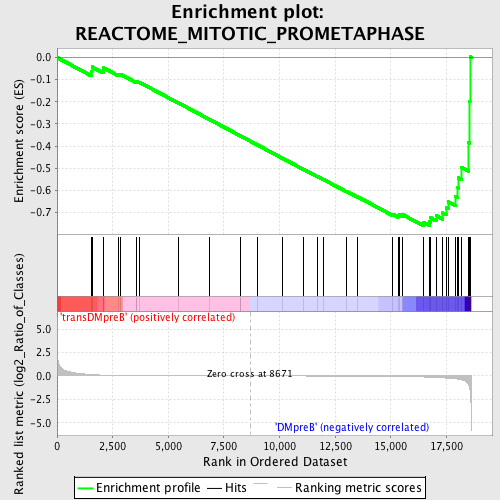
Profile of the Running ES Score & Positions of GeneSet Members on the Rank Ordered List
| Dataset | Set_04_transDMpreB_versus_DMpreB.phenotype_transDMpreB_versus_DMpreB.cls #transDMpreB_versus_DMpreB.phenotype_transDMpreB_versus_DMpreB.cls #transDMpreB_versus_DMpreB_repos |
| Phenotype | phenotype_transDMpreB_versus_DMpreB.cls#transDMpreB_versus_DMpreB_repos |
| Upregulated in class | DMpreB |
| GeneSet | REACTOME_MITOTIC_PROMETAPHASE |
| Enrichment Score (ES) | -0.76118 |
| Normalized Enrichment Score (NES) | -1.5695728 |
| Nominal p-value | 0.015655577 |
| FDR q-value | 0.6262379 |
| FWER p-Value | 0.974 |
| PROBE | DESCRIPTION (from dataset) | GENE SYMBOL | GENE_TITLE | RANK IN GENE LIST | RANK METRIC SCORE | RUNNING ES | CORE ENRICHMENT | |
|---|---|---|---|---|---|---|---|---|
| 1 | MLF1IP | 18622 | 1531 | 0.154 | -0.0611 | No | ||
| 2 | RANBP2 | 20019 | 1569 | 0.149 | -0.0426 | No | ||
| 3 | CLASP1 | 14159 | 2074 | 0.086 | -0.0579 | No | ||
| 4 | NUP107 | 8337 | 2091 | 0.084 | -0.0471 | No | ||
| 5 | KIF2A | 9217 11438 | 2767 | 0.044 | -0.0773 | No | ||
| 6 | NUP160 | 14957 | 2826 | 0.042 | -0.0746 | No | ||
| 7 | CLASP2 | 13338 | 3558 | 0.024 | -0.1107 | No | ||
| 8 | PPP1CC | 9609 5283 | 3588 | 0.024 | -0.1089 | No | ||
| 9 | PLK1 | 9590 5266 | 3681 | 0.022 | -0.1108 | No | ||
| 10 | MAPRE1 | 4652 | 5436 | 0.008 | -0.2041 | No | ||
| 11 | KNTC1 | 16705 | 6870 | 0.004 | -0.2807 | No | ||
| 12 | CDCA8 | 11966 6977 | 8242 | 0.001 | -0.3544 | No | ||
| 13 | CENPE | 15414 | 8244 | 0.001 | -0.3543 | No | ||
| 14 | BUB1 | 8665 | 9007 | -0.001 | -0.3952 | No | ||
| 15 | KIF2B | 20295 | 10123 | -0.003 | -0.4548 | No | ||
| 16 | CENPC1 | 8737 | 11067 | -0.006 | -0.5048 | No | ||
| 17 | CLIP1 | 3603 7121 | 11705 | -0.007 | -0.5380 | No | ||
| 18 | BIRC5 | 8611 8610 4399 | 11978 | -0.008 | -0.5515 | No | ||
| 19 | XPO1 | 4172 | 13007 | -0.014 | -0.6049 | No | ||
| 20 | STAG2 | 5521 | 13520 | -0.018 | -0.6300 | No | ||
| 21 | NDC80 | 22900 | 15076 | -0.043 | -0.7078 | No | ||
| 22 | SGOL1 | 7810 7809 13030 | 15323 | -0.050 | -0.7141 | No | ||
| 23 | PMF1 | 12452 | 15398 | -0.052 | -0.7109 | No | ||
| 24 | RAD21 | 22298 | 15539 | -0.058 | -0.7104 | No | ||
| 25 | SEC13 | 17039 | 16484 | -0.112 | -0.7457 | Yes | ||
| 26 | BUB1B | 14908 | 16725 | -0.134 | -0.7402 | Yes | ||
| 27 | CDC20 | 8421 8422 4227 | 16798 | -0.142 | -0.7245 | Yes | ||
| 28 | ZWINT | 19992 | 17037 | -0.169 | -0.7140 | Yes | ||
| 29 | BUB3 | 18045 | 17339 | -0.202 | -0.7023 | Yes | ||
| 30 | CENPA | 8736 | 17496 | -0.224 | -0.6798 | Yes | ||
| 31 | ZW10 | 3114 19464 | 17581 | -0.236 | -0.6517 | Yes | ||
| 32 | RANGAP1 | 2180 22195 | 17893 | -0.297 | -0.6275 | Yes | ||
| 33 | NUP43 | 20094 | 18012 | -0.327 | -0.5886 | Yes | ||
| 34 | MAD2L1 | 17422 | 18040 | -0.335 | -0.5438 | Yes | ||
| 35 | SGOL2 | 14247 | 18167 | -0.398 | -0.4956 | Yes | ||
| 36 | NUP37 | 3294 3326 19909 | 18492 | -0.934 | -0.3840 | Yes | ||
| 37 | SMC1A | 2572 24225 6279 10780 | 18543 | -1.376 | -0.1967 | Yes | ||
| 38 | PAFAH1B1 | 1340 5220 9524 | 18560 | -1.453 | 0.0030 | Yes |

