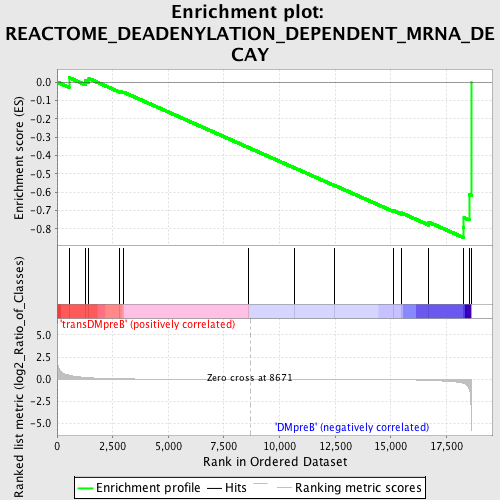
Profile of the Running ES Score & Positions of GeneSet Members on the Rank Ordered List
| Dataset | Set_04_transDMpreB_versus_DMpreB.phenotype_transDMpreB_versus_DMpreB.cls #transDMpreB_versus_DMpreB.phenotype_transDMpreB_versus_DMpreB.cls #transDMpreB_versus_DMpreB_repos |
| Phenotype | phenotype_transDMpreB_versus_DMpreB.cls#transDMpreB_versus_DMpreB_repos |
| Upregulated in class | DMpreB |
| GeneSet | REACTOME_DEADENYLATION_DEPENDENT_MRNA_DECAY |
| Enrichment Score (ES) | -0.84629506 |
| Normalized Enrichment Score (NES) | -1.4716125 |
| Nominal p-value | 0.02734375 |
| FDR q-value | 0.5692276 |
| FWER p-Value | 1.0 |
| PROBE | DESCRIPTION (from dataset) | GENE SYMBOL | GENE_TITLE | RANK IN GENE LIST | RANK METRIC SCORE | RUNNING ES | CORE ENRICHMENT | |
|---|---|---|---|---|---|---|---|---|
| 1 | EIF4G1 | 22818 | 537 | 0.453 | 0.0243 | No | ||
| 2 | CNOT4 | 7010 1022 | 1280 | 0.194 | 0.0072 | No | ||
| 3 | EIF4B | 13279 7979 | 1431 | 0.169 | 0.0191 | No | ||
| 4 | EXOSC6 | 7818 | 2819 | 0.042 | -0.0505 | No | ||
| 5 | XRN1 | 10797 | 2984 | 0.037 | -0.0550 | No | ||
| 6 | CNOT3 | 6112 10565 6113 | 8592 | 0.000 | -0.3564 | No | ||
| 7 | EXOSC9 | 15610 | 10673 | -0.005 | -0.4677 | No | ||
| 8 | EIF4E | 15403 1827 8890 | 12487 | -0.011 | -0.5639 | No | ||
| 9 | EIF4A1 | 8889 23719 | 15134 | -0.045 | -0.7009 | No | ||
| 10 | EXOSC2 | 15044 | 15480 | -0.055 | -0.7129 | No | ||
| 11 | EXOSC7 | 19256 | 16707 | -0.132 | -0.7632 | No | ||
| 12 | PARN | 22659 | 18253 | -0.455 | -0.7929 | Yes | ||
| 13 | LSM3 | 12565 | 18288 | -0.476 | -0.7387 | Yes | ||
| 14 | DDX6 | 3086 8844 | 18520 | -1.168 | -0.6140 | Yes | ||
| 15 | PABPC1 | 5219 9522 9523 23572 | 18615 | -5.269 | 0.0001 | Yes |

