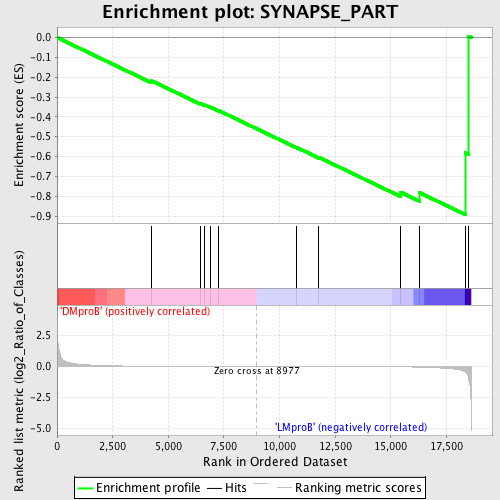
Profile of the Running ES Score & Positions of GeneSet Members on the Rank Ordered List
| Dataset | Set_04_DMproB_versus_LMproB.phenotype_DMproB_versus_LMproB.cls #DMproB_versus_LMproB |
| Phenotype | phenotype_DMproB_versus_LMproB.cls#DMproB_versus_LMproB |
| Upregulated in class | LMproB |
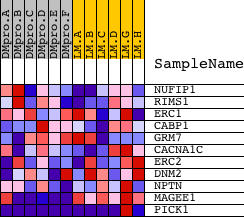
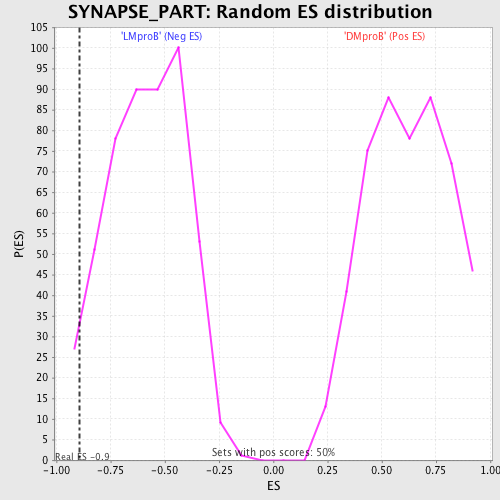
| GeneSet | SYNAPSE_PART |
| Enrichment Score (ES) | -0.89201784 |
| Normalized Enrichment Score (NES) | -1.530814 |
| Nominal p-value | 0.02004008 |
| FDR q-value | 0.7370017 |
| FWER p-Value | 1.0 |
| PROBE | DESCRIPTION (from dataset) | GENE SYMBOL | GENE_TITLE | RANK IN GENE LIST | RANK METRIC SCORE | RUNNING ES | CORE ENRICHMENT | |
|---|---|---|---|---|---|---|---|---|
| 1 | NUFIP1 | 21955 | 4249 | 0.014 | -0.2183 | No | ||
| 2 | RIMS1 | 8575 | 6443 | 0.005 | -0.3325 | No | ||
| 3 | ERC1 | 1013 17021 995 1136 | 6638 | 0.004 | -0.3397 | No | ||
| 4 | CABP1 | 16412 | 6896 | 0.004 | -0.3507 | No | ||
| 5 | GRM7 | 17338 | 7272 | 0.003 | -0.3686 | No | ||
| 6 | CACNA1C | 1158 1166 24464 4463 8674 | 10743 | -0.003 | -0.5529 | No | ||
| 7 | ERC2 | 17531 | 11764 | -0.005 | -0.6041 | No | ||
| 8 | DNM2 | 4635 3103 | 15435 | -0.030 | -0.7794 | No | ||
| 9 | NPTN | 9794 | 16303 | -0.060 | -0.7826 | Yes | ||
| 10 | MAGEE1 | 24272 | 18340 | -0.431 | -0.5812 | Yes | ||
| 11 | PICK1 | 9560 22424 | 18483 | -0.827 | 0.0071 | Yes |