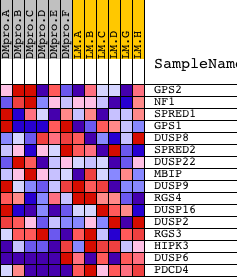
Profile of the Running ES Score & Positions of GeneSet Members on the Rank Ordered List
| Dataset | Set_04_DMproB_versus_LMproB.phenotype_DMproB_versus_LMproB.cls #DMproB_versus_LMproB |
| Phenotype | phenotype_DMproB_versus_LMproB.cls#DMproB_versus_LMproB |
| Upregulated in class | LMproB |
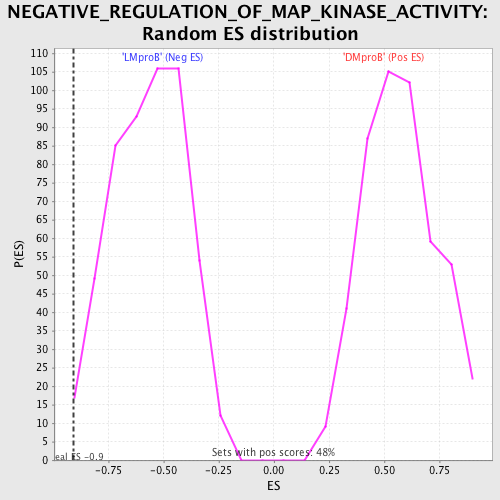
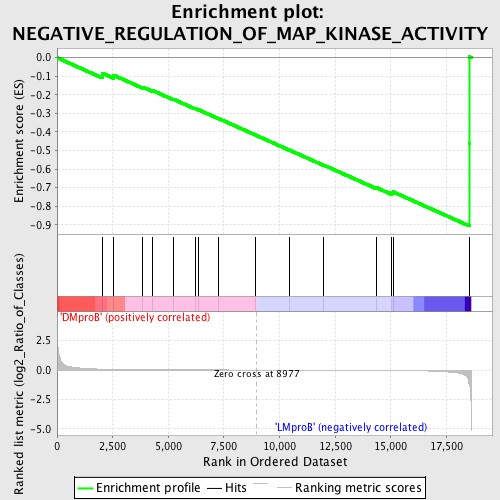
| GeneSet | NEGATIVE_REGULATION_OF_MAP_KINASE_ACTIVITY |
| Enrichment Score (ES) | -0.90668124 |
| Normalized Enrichment Score (NES) | -1.5969973 |
| Nominal p-value | 0.009578544 |
| FDR q-value | 0.6273102 |
| FWER p-Value | 0.944 |
| PROBE | DESCRIPTION (from dataset) | GENE SYMBOL | GENE_TITLE | RANK IN GENE LIST | RANK METRIC SCORE | RUNNING ES | CORE ENRICHMENT | |
|---|---|---|---|---|---|---|---|---|
| 1 | GPS2 | 12096 | 2029 | 0.070 | -0.0835 | No | ||
| 2 | NF1 | 5165 | 2532 | 0.046 | -0.0937 | No | ||
| 3 | SPRED1 | 4331 | 3849 | 0.018 | -0.1580 | No | ||
| 4 | GPS1 | 1392 9943 5550 9944 | 4280 | 0.014 | -0.1761 | No | ||
| 5 | DUSP8 | 9493 | 5235 | 0.009 | -0.2242 | No | ||
| 6 | SPRED2 | 8539 4332 | 6205 | 0.006 | -0.2742 | No | ||
| 7 | DUSP22 | 466 21680 | 6359 | 0.005 | -0.2805 | No | ||
| 8 | MBIP | 21063 2072 | 7259 | 0.003 | -0.3277 | No | ||
| 9 | DUSP9 | 24307 | 8900 | 0.000 | -0.4158 | No | ||
| 10 | RGS4 | 9724 | 10425 | -0.002 | -0.4969 | No | ||
| 11 | DUSP16 | 1004 7699 | 11995 | -0.006 | -0.5792 | No | ||
| 12 | DUSP2 | 14865 | 14352 | -0.016 | -0.7000 | No | ||
| 13 | RGS3 | 2434 2474 6937 11935 2374 2332 2445 2390 | 15048 | -0.024 | -0.7287 | Yes | ||
| 14 | HIPK3 | 14504 | 15104 | -0.024 | -0.7228 | Yes | ||
| 15 | DUSP6 | 19891 3399 | 18525 | -1.221 | -0.4618 | Yes | ||
| 16 | PDCD4 | 5232 23816 | 18530 | -1.281 | 0.0046 | Yes |